longGO FOR IT.... my oppinion is there is a huge pump in LONG TERM awaits in this area,but if break the bottom chanell its go for short for a while.good luck
RLCUSDT trade ideas

RLC BreakoutAfter a Longtime RLC Broke the Neckline and Resistance Area and Retest also Done
Entering here Target is mentioned in the Chart
DYOR Before Entering any Trade

RLC AnalysisRLC / USDT
Still above uptrendine which started since beginning of 2021
there are some dynamic resistance (200d EMA)
after closing above this resistance daily it will become bullish
Invalidation: closing below uptrendine by daily close turn bearish
Best of luck

RLC Breakout Asd we have accumulated waiting for this and its broken out nicely, currently testing 1st level of resistance.
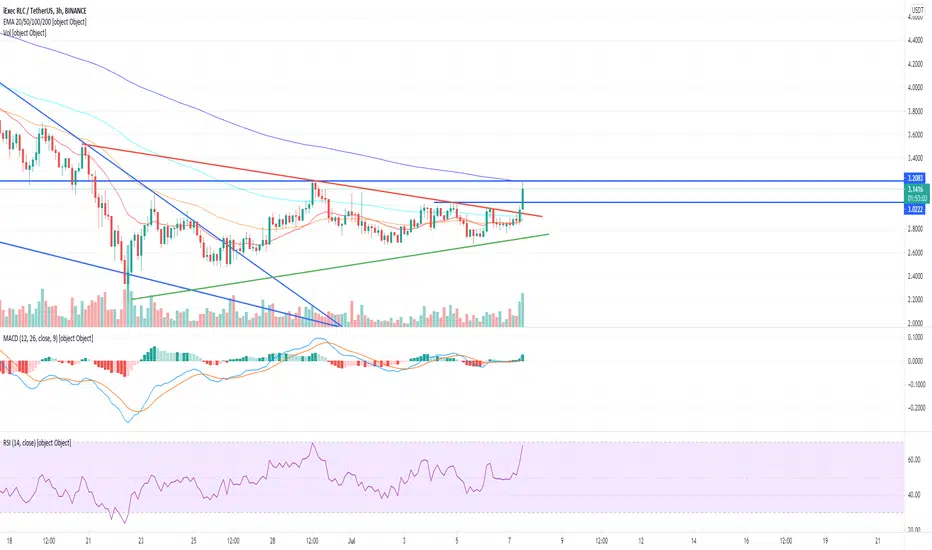
RLCUSDT Triangle Formation!RLCUSDT (1H CHART) Technical Analysis Update
Triangle Breakout
RLC/USDT currently trading at $2.97
Buy-level: $2.94 - $2.96 (Wait for the small retracement)
Stop loss: Below $2.82
Target 1: $3.08
Target 2: $3.20
Target 3: $3.56
Max Leverage: 2X
ALWAYS KEEP STOP LOSS...
Follow Our Tradingview Account for More Technical Analysis Updates, | Like, Share and Comment Your thoughts.


RLCUSDT FUTURES TRADING ABOVE STRONG HOURLY SUPPORT ZONEBUY RLCUSDT ON MENTIONED RATES, IT HAS FORMED GOOD HOURLY SUPPORT AT 3.10 and THIS SHOULD BE THE STOPLOSS IF IT BREAKS 3.10 YOU COULD OPEN YOUR SHORT POSITIONS.


RLC Making movesRLC heading back up to test resistance, see $3.8 then $4.2 major resistance needing to be clerared before can make serious moves.

Short -RLCShort
Reasons,
Fakeout detected confluent supply zone in grey box.
Targets and invalidation in the chart
Risk 1%

Rlc short 16% Follow the chart
My previous long idea on Rlc got ban.
Follow for quick update on Rlc breakdown

RLC Break Out Of Wedge FormationRLC has broken out of the daily wedge formation and has some nice volume coming in, next resistance $3.80


RLC Expected Breakout NearingAs we covered recently RLC is set to break out, currently testing resistance and cant possibly get ant tighter here, expect is coming very soon.
Refer website for more TA

RLC/USDT Daily ChartBTC dump has put a end to the RLC breakout however still remains within the daily falling wedge formation.
Buying at below $5 will not be availabe for long and my suggested accumulation at these levels is still strong as I continue to dollar cost average my possition filling the bags deeper.
* Not financial advice


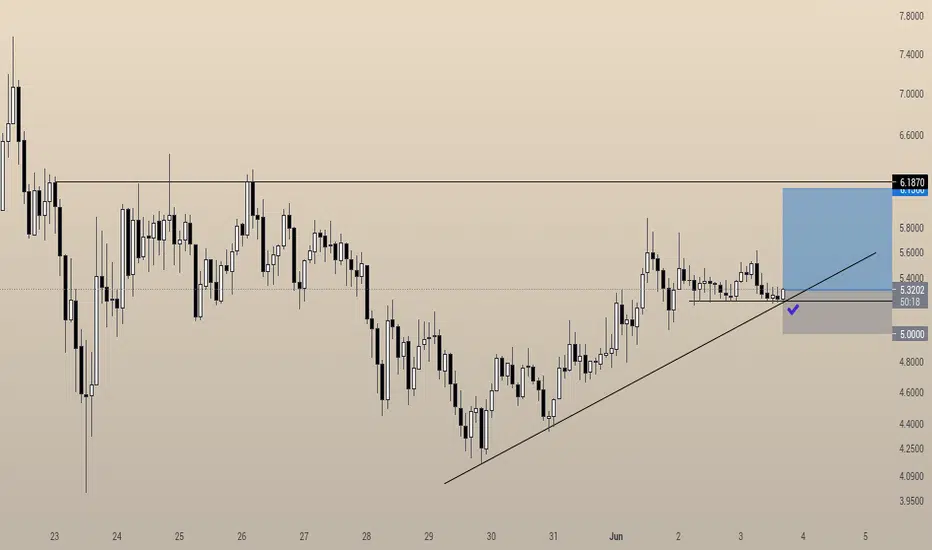
Scalp Long - RLCLong
Reason,
Ascending trendline touched tree times, confluent retest at local PA support,
Expected a jump here,
Targets / invalidation point in the chart

RLC/USDT 4HR Chart - Breakout Iminent RLC is in a long term galling wedge abd currently testing resitance trendine.
Fantastic entry level. Last month we entered at $4 and got a 4X in 3 days. It wont be $5 much longer.


#RLC LONG POSOTION 147% Profit!!BINANCE:RLCUSDT
#RLC (RLC/USDT) LONG POSOTION 147% Profit 4H Chart !!
#RLCUSDT

RLC Value Areas! This is where you BUY!!Let’s talk about how amazing $RLC looks here on the daily.
💥 Hidden bullish divergence on the MACD
💥 Hidden bullish divergence appeared at a consolidation zone looking left acting as a support
💥 Potential double bottom
💥 78.6% Retrace from High to Low if you fib from the November 5th, 2020 low to the May 10th, 2021 high.
💥 I'm still learning harmonics (XABCD) so I'm not sure if there is any bullish harmonic pattern on the chart yet but you can see that I plotted an XABCD. Even though it's probably nothing in terms of a specific bullish harmonic like a gartley, butterfly, shark, cypher etc. it still is an XABCD with a 83.6% retrace. Yes, thats right. There is a 83.6% SALE on $RLC.
Thanks
