RLCUSDT trade ideas

RLCYOUR LIKE OR COMMENT IS MY FUEL FOR NEXT ANALYSIS :)
This is not a financial advice. Always do your own research and always put stoploss in your trade (SL) :) If you want more detailed info how to study and read charts or just need help with some coin, just write to me here a comment, i will try to answer to everybody... i can help you :) all for free, don't worry, BE HAPPY!
If u like the analysis, please feel free to ask any question about this TA or crypto or any coin - leave a comment or like or share the idea, i really appreciate it because then my work makes sense :) thanks!

RLC - can this expode?****************************************************************************************************************************************************************************************************************************************
This is not a financial advice. Always do your own research and always put stoploss in your trade (SL) :) If you want more detailed info how to study and read charts or just need help with some coin, just write to me here personal message, i will try to answer to everybody... i can help you :) all for free, don't worry, BE HAPPY!
If u like the analysis, please feel free to ask any question about this TA or crypto or any coin and also leave a comment or like or share the idea, i really appreciate it because then my work makes sense :) thanks!


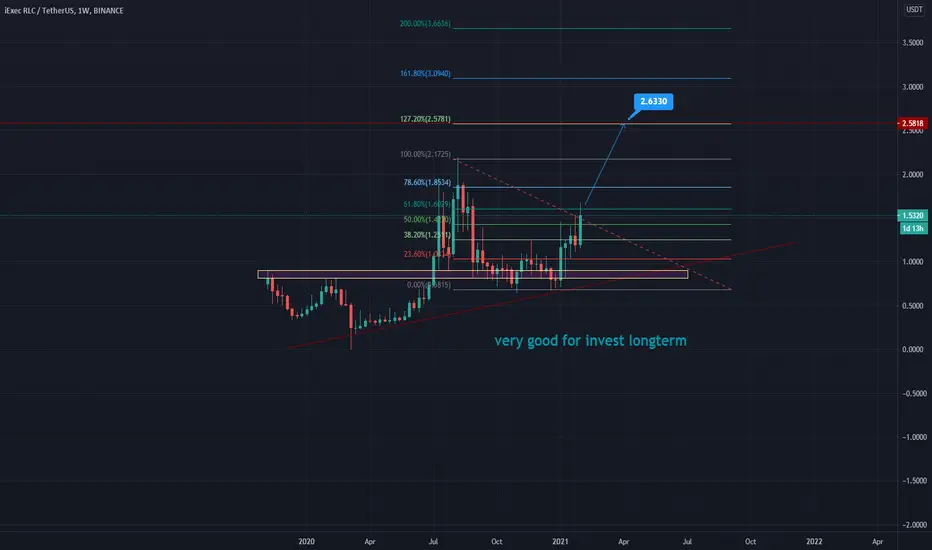
LONG RLCRLC have completed the abc correction . i think from my opinion, it will be on the way up from here.

RLC/USDT LOOKING FOR REVERSAL WITH ASCENDING TRIANGLE 🚖Hey hey my friends 👋
BTC looks to be settling down 🧘♀️
Take a look at this one here we are forming a bullish reversal pattern we are either going to take off or range the triangle before take off 🚀
Watch it 👀

RLC PREDICT FOR FEB & MARCH 2021 GO TO NEW SUPER ATH RLC PREDICT FOR FEB & MARCH 2021
GO TO NEW SUPER ATH


RLCUSDT's Historic MoveHello guys! I will share to you my technical experiment on ELCUSDT, I believe that this coin will do a historic move. For so, my buying area is $2.2 and $1.8. If this will be true, this coin pair will go to 2.8and even higher. This is a 1 week time frame but I believe that before March ends, it can go up to $3.2.


RLC/USDT LOOKIN GOOD 🚖Hey hey my friends 👋
We have a lot of good altcoin setups coming up!
Stay tuned 📺

RLCUSDTentry: around 2.18
TP1: 2.55
TP2: 2.79
TP3: 2.93
TP4: 3.11
SL: 1.8752
Check my website for tutorials, examples and calls :)
cry-pto-surf.com
- My trades are not financial advices
- always use stop-loss
- invest only the amount of money you are ready to lose
- trade with a strict money management method


RLC.USDT (Y21.P1.E1).Macro.TAHi All,
Going with some patterns here, I'm guessing RLC is done the top and is doing its correction wave.
Based on its previous rise, I'm looking for patterns, support and resistance trendlines.
My guess is that it will retrace to the 0.5 or to the 0.618 level before reversing.
See if you can make sense of this.
All the best,
S.SAri
If BTC dominance is to go up, this fits into the narrative.

RLC formed BAT move for up to 27% rallyHi friends, hope you are well and welcome to the new update on iExec RLC token.
On a small time period 4-hr chart, the price action of the RLC has completed the final leg of bullish BAT and spiked in the potential reversal zone. It may give us another chance to catch from the buying zone before starting the bullish rally.
this trade has profit possibility of 27% and the loss possibility is only 4%
Note: Above idea is for educational purpose only. It is advised to diversify and strictly follow the stop loss, and don't get stuck with the trade


RLCUSDT: Flirting with major resistance - Awaiting breakoutRLCUSDT is approaching major resistance. Even the volume is impressive.
Once this breakout and close above the resistance level then BOOM.


RLC Breakout!RLC just broke out of this major resistance. I expect the price to skyrocket before March.

RLC READY TO CONFIRM THE TREND!Here is another nice chart with huge potential as it only $133M market cap. Possible 10x as well in this bull run.

#RLCUSDT #WeeklyHi guys..its the latest analyze chartof RLCUSDT in Weekly time frame .if you are interested any crypto that you want analyze with me and any questions please do not hesitate and comment below the chart!
if u like it press like-comment and folow me.thx