RLCUSDT trade ideas

I expect RLC to move in this channelWe have two options:
If supported, prices could rise.
or
it passes through the middle of the channel,Falling will be possible

RLC - USDTResistence at 0.96 ( Long if break )
or waiting at Buying Zone 0.85 - 0.9
Very tight SL : 0.79
TP : 1.0 - 1.1 - 1.2 - 1.3 - 1.4 ---- 1.5 ++++
DWYOR


RLC Making That Bullish Reversal?My Fellow Crypto Traders,
Appreciate you taking the time to view my analysis which I hope you may find beneficial. Please be sure to “LIKE” if you indeed find my analysis useful and/or find my analysis intriguing.
Cheers & Happy Trading!


RLC Breaking OutRLC retested this summer's breakout starting point, and is now attempting to breakout. Volume has been steady, trend is on its side and it can ride the altszn narrative.

RLCUSDT - Elliottwave analysis - C down cycle RLCUSDT - It is in C wave down within ABC zigzag pattern. The sharp drop was 1st wave of C and it seems like 2nd wave correction was finished. Sell it here with stop level above 1.0830 for target below 0.75 or lower level.
Give thumbs up if you really like the trade idea.

RLCUSDT - Elliottwave analysis - C down cycleRLCUSDT - It is in 1st wave down and about to finish soon. Thereafter 2nd wave correction of C wave up expected to move higher up to 1.009-1.0335 zone, Sell with stop level above 1.0829 for target below 0.75 or lower level.
Give thumbs up if you really like the trade idea.


RLCUSDT - Elliottwave analysis - 5th of C wave upRLCUSDT - It is in ABC zigzag up and seems like 4th wave correction in progress. So pump it near 1.1239 level with stop level below 1.0792 for target above 1.250 as 5th of C wave up.
Give thumbs up if you really like the trade idea.

RLCUSDTPERP - Long - Potential 19.54% ***NEW TRADE SET_UP"**
RLCUSDTPERP - Long - Potential 19.54%
Optional Leverage: 3x - 5x
Entry- 1.1291
TP1(75%) - 1.2087
TP2- (25%) - 1.3497
SL- 1.0181
- MANAGE TRADE- BTC VOLATILITY
- RR - 1.99
- Trailing Buy - 0.5%
- Trailing Profit - 1%
- Trailing Stop-Loss - No

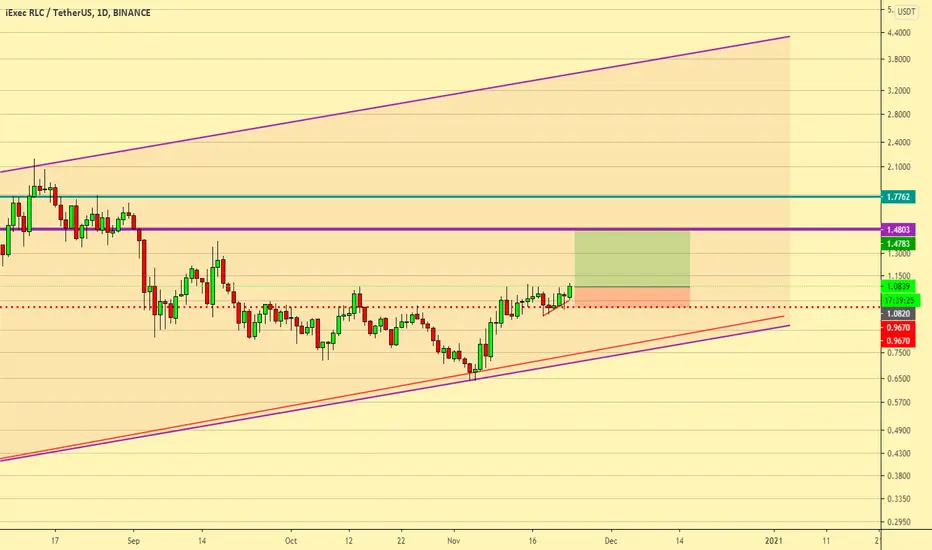
iExec RLC$RLC binance
RLC/USDT
EP : 1.083
SL: 0.967
TP1: 1.26
TP2: 1.47
TP3: 1.77
there is some bullish patterns
RLCUSDT - key levelPreconditions:
- Bullish trend locally.
- globally bullish trend.
- accumulation before the breakout.
- R/R - 1/9
Friends, push the like button, write a comment, and share with your mates - that would be the best THANK YOU

RLC ( USDT )RLC buy after breakout or waiting to entry area between 0.55 - 0.65
SL : under 0.5
TP : green line
RSI also breakdwn from trendline
DWYOR

RLCUSDT - Strong historical level.Perfect bear wedge.
This structure indicates a bear market.
Strong historical level.
Testing the level a few months later.
I expect to see an imbalance in this area.
The zone of profit taking.

RLC/USDT looking bullish Rlc / usdt
Analysis
Became back above trend support
Break trendline resistance
Bullish green candels
Break local resistance between 0.87-0.935
As long as RLC above this local support we can expect big pumps like before
Please have a plan before trading and use stoploss
Good luck and happy trading


BINANCE:RLCUSDT🛒 Pair: RLC/USDT 🛒
== SPOT==
⏰ 1399/08/19 ⏰
🕰 09/11/2020 🕰
Duration:
📈 SHORT - MID 📈
Ex: Binance
🛒 Buy1 :0.89 - 0.90 🛒 1/3
🛒 Buy2 :hidden - hidden 🛒 2/3
👉Sell Targets👈
🎯TP1: 0.945 🥉
🎯TP2: hidden 🥈
🎯TP3: hidden 🥇
🎯TP4: hidden 🏆
🎯TP5: hidden 🚁
🎯TP6: hidden ✈️
⛔️ SL: 0.7494 ⛔️ with 4Hrs. candle closing below

RLCUSDT next LongRLCUSDT long coming for a nice swing.. a clear breakout of wedge...i wanna long on retest of support...not before that

