$RNDR bullish momentum? EURONEXT:RNDR is showing signs of life at a major support level.
After a significant pullback, RNDR is finding solid ground in the $2.90 range, a critical area that previously acted as resistance. The 4-hour chart is flashing a bullish divergence on the Stochastic oscillator, suggesting the downward momentum is fading.
This could be the accumulation zone before the next major rally.
#RNDR #Render #CryptoTrading #TechnicalAnalysis #Bullish
RNDRUSD trade ideas
Render get in earlyI think we finished the abc correction for the wave 4, now just made a 1 and 2? Now gearing up for higher highs.

RENDER - Ready To PopRender is printing a delightful low time frame snowflake.
It is a coiling and very shallow descending channel.
In higher time frame this channel is printing on the 0.786 overshoot ratio of the 1:0.618 with only wicks below:
The 0.786 is a common ratio for a pivot.
And that can potentially complete a 3 wave correction leading into the next wave up.
The 1:0.618 is a weak ratio since the third wave would be shorter than the first.
The signals downside weakness.
This looks ready to pop if Bitcoin can drift on up 👍.
Not advice

Long Render from 3.88 to 6 dollars Double bottom on the daily chart. Weekly divergence in play with strong volume.
Be prepared to buy more at 3.65 zone if we get that chance.
The target is modest as we could be going to exceed the previous top of 11.85 dollar

ALTS Shine, +55% INCREASE !! FTM | RNDR | Render and Fantom have made steep increases over the past two weeks.
In the past two weeks, FTM increased a whopping 55%:
And RNDR increased around the same amount:
This naturally makes it likely to see a correction soon, which may be the ideal time to get into the accumulation boat - or just for a swing trade.
________________________
GEMINI:RNDRUSD CRYPTO:FTMUSD

Render!! Aiming for ATHYeah, i see 5 waves up for the wave 3, and i see a abc correction with 5 waves to finish the wave C (end of wave 4) So now entering the last wave. On smaller timeframe you can already see a beautifull Cup and handle reversal pattern. Good luck, trade save, let me know what you think

Buy Render**Buy Render (RNDR)**
The weekly RSI has dropped below 40, signaling oversold conditions and a potential buying opportunity.
Beyond technicals, Render is fundamentally strong:
✅ **Leader in Decentralized GPU Rendering** – The network provides scalable GPU computing power for rendering graphics, AI, and metaverse applications.
✅ **Rising Demand for AI & 3D Workloads** – As AI, virtual reality, and 3D content creation grow, Render’s decentralized model offers cost-effective and efficient solutions.
✅ Strong Partnerships & Adoption**—Backed by major industry players, the Render Network is gaining traction in the creative and enterprise sectors.
With technicals aligning with a fundamentally bullish long-term outlook, this could be an attractive entry point.

RNDR (Render); my notes for long-termAs long as the $3.3-3.8 supports are not lost, there is no problem in the long term, it looks good. My close targets are $6.5 and $10. If it stays above $10 and good data continues to come, I will continue to hold and update my targets to 13 - 19 - 24 dollars.
These are notes I write for myself, so as not to forget. This is not investment advice, so please make your own decisions.

RNDR SHORT/LONGWe had a strong reaction from $3.5, with a bounce of nearly 50%. Currently, the price is at a support level of around $4.1.
From here, the price could either consolidate or gradually move lower toward $3.5, possibly even $3, as the Stoch RSI still has room to go down.
However, a short-term rally toward the 21 EMA on the daily timeframe ($5.6) is also possible.
I'm considering entering a short if the price makes a fakeout above the 21 EMA, targeting at least $4. After that, if the setup aligns, I would look for opportunities to scale into long positions. We also need to remember that on February 11, RNDR will release 0.10% of its total supply into circulation.
This could add some selling pressure, so it’s worth considering when evaluating potential price movements.

RNDR bottomFinal rndr fib touch on .786, should see -.27.
seems like an extremely good opportunity to load up

Possible support for RenderBeen charting this for a while and had this as a significant level and looking like a bounce on it, just my thoughts.

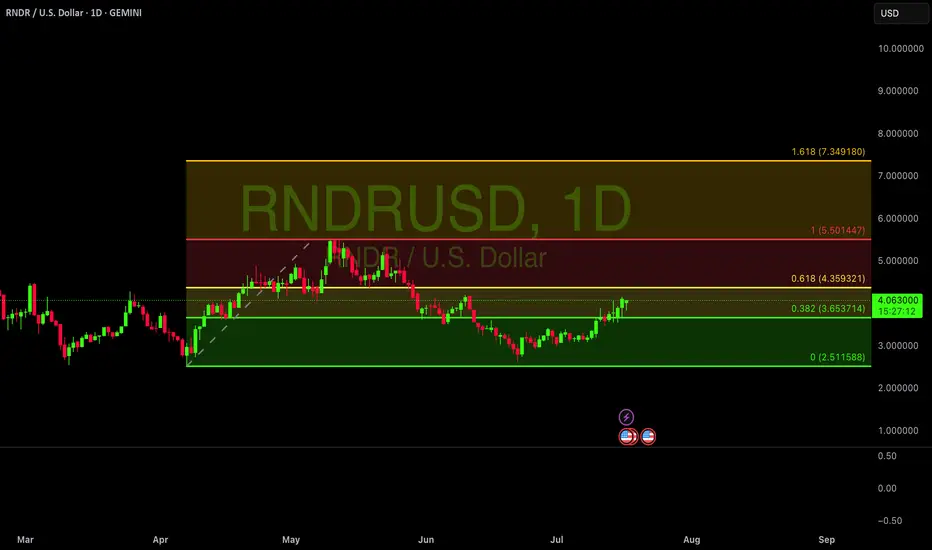
Buy RNDRRender is looking to bounce off the 0.618 level of its last push. It's a considerable conviction pick for me, and it is only a matter of time before it takes off.

RNDR Chart AnalysisLets break it down:
Structure and Price Action:
**Rising Wedge Formation**:
The chart shows a **rising wedge**, which is typically a bearish reversal pattern. Price is currently trading near the lower boundary of the wedge, increasing the likelihood of a breakdown.
**Red Resistance Zone**:
The price rejected the key **red resistance zone** between $10.0–$11.0, indicating strong selling pressure.
**Higher Lows**:
Despite rejection at resistance, the price has maintained **higher lows**, signaling bullish attempts to sustain the uptrend.
**Bearish Momentum Developing**:
Price is now testing the rising support line. A breakdown here could lead to a reversal toward lower levels.
Support and Resistance:
**Immediate Resistance**: $10.0–$11.0 (red resistance zone where sellers are dominant).
**Key Support Levels**:
$8.50: Rising support line and psychological level.
$7.50–$7.00: Green order block area where buyers previously stepped in.
Below $7.00: Strong support near $5.50–$5.00 (historical support zone).
Indicators:
Moving Averages (EMA 20/50/100/200):
Price remains above the **EMA 20** ($8.96) and EMA 50 ($7.82), showing bullish bias in the short-term trend.
The **EMA 100/200** at $7.03 and $6.68, respectively, provide stronger long-term support.
Money Flow Index (MFI):
**58.08** indicates neutral momentum but leaning slightly toward bullish, suggesting buyers still have some control.
Stochastic RSI:
The Stochastic RSI is currently near **oversold territory** (11.56), suggesting a potential bounce from support levels.
However, if price fails to hold support, oversold conditions can persist, leading to further downside.
Volume:
Volume during the recent move upward has been declining, suggesting weakening bullish momentum.
Watch for a volume spike on any breakout or breakdown to confirm direction.
Pattern Analysis:
The **rising wedge** pattern signals caution as it leans bearish. A breakdown below the wedge's lower trendline would confirm a reversal.
Rejection at the red resistance zone strengthens the bearish outlook unless bulls regain control.
Probabilistic Outlook:
Bearish Breakdown (Primary Scenario):
If price breaks below the rising support line (~$8.50), bearish momentum will increase.
Key downside targets:
**First Target**: $7.50 (order block zone).
**Second Target**: $7.00–$6.50 (EMA 100/200 levels).
**Third Target**: $5.50–$5.00 (major historical support).
Bullish Continuation (Alternate Scenario):
If price reclaims $10.0–$11.0 with strong volume, the uptrend will resume.
Key upside targets:
**First Resistance**: $11.50.
**Second Resistance**: $12.00–$12.50 (previous highs).
Key Signals to Watch:
A breakdown below the rising support line (~$8.50) = **Bearish confirmation**.
A breakout above $10.0–$11.0 resistance = **Bullish continuation**.
Volume spike during breakout or breakdown will confirm the move.
Conclusion:
The chart shows a **rising wedge** with weakening bullish momentum, increasing the probability (~65–70%) of a bearish breakdown. A decisive break below $8.50 would target lower levels at $7.50 and beyond. Conversely, a breakout above $10.0–$11.0 could invalidate the wedge and continue the uptrend toward $12.00.

Render Network RENDER Long: EWT Analysis & Cycle Peak Targets+ Possible overextended Wave 5 count now?
Trading within Wave (3) of Wave V impulse.
Any major peaks in RENDER have extended as high as the following fib extensions...
The target is the peaks of the parallel channel, confluence with the fib extensions targets:
- 1.414
- 1.618
Last Rally for Cycle Wave V (five) topping around Nov/Dec 2025 being a blow off top.

RNDR | BULLISH ALTS | RNDR Incoming ATH Render has been one of my top alts since Jan 2024, and it hasn't disappointed, currently standing at 140% increase, and if you account for the ATH in March, 245%.
As Bitcoin trades range we're patiently waiting for Ethereum to make a new ATH. This will encourage the rest of alts to make a final push up, that is AFTER ETH made a new ATH. That's why it's so important to watch Ethereum, and the Bitcoin dominance chart.
More on that topic HERE:
____________________
GEMINI:RNDRUSD

Speculative inverse head & shoulders opportunity on renderRender just had a big spike and then corrected back down to the breakout target of the previous triangle pattern it broke up from (which I will link to below). In doing this, render has created the opportunity to form a right shoulder now to a potential inverse head and shoulders pattern, as long as it stays below the top of todays candle’s top wick for the next few daily candles. If so, it then gives us a new price target we can look forward to heading towards once it breaks out of that pattern of around $20. For now this is speculative, for if render just resumes pumping and heads past the recent daily candle high the inverse head and shoulders pattern will no longer be in play *not financial advice*

Symmetrical triangle/invh&S on render breaking abve toptrendlineNo guarantee that it confirmed the breakout on the first break above the pattern here, but the way the market has been moving lately thee is a high probability it will. *not financial advice*

#RNDR Adding to the position here on #RNDR, though looks risky still as we haven't broken out so will add full size once we break the resistance

RNDR.usd eyes on $7.46 to break with 6.55 Golden Genesis supportRNDR has made a nice strong leg up recently.
Broke and retested a Golden Genesis below.
Now breaking a minor but key fib just above.
Prices are from Coinbase, others will vary a bit.

RNDR looks good to about $10Seems to be breaking out, next major resist seems to be around $10, thats it, nothing else, its a chart breakout, alerting as it breaks. Orderbooks have been looking pretty good too. Channel breakouts usually perform well in short order. Looking at the 4 hour chart, it may not be ready to break yet, may pull back a little before we see a solid break through.
This is not trade advice, DYOR.

Render/RNDR Lond- 420 day Bullish Gartley
- Three Rising Valleys
- Bullish Divergence x2
- Backtest of major support
Just the best you can ask for. Anything can always happen, but this is as good as you can ask for.

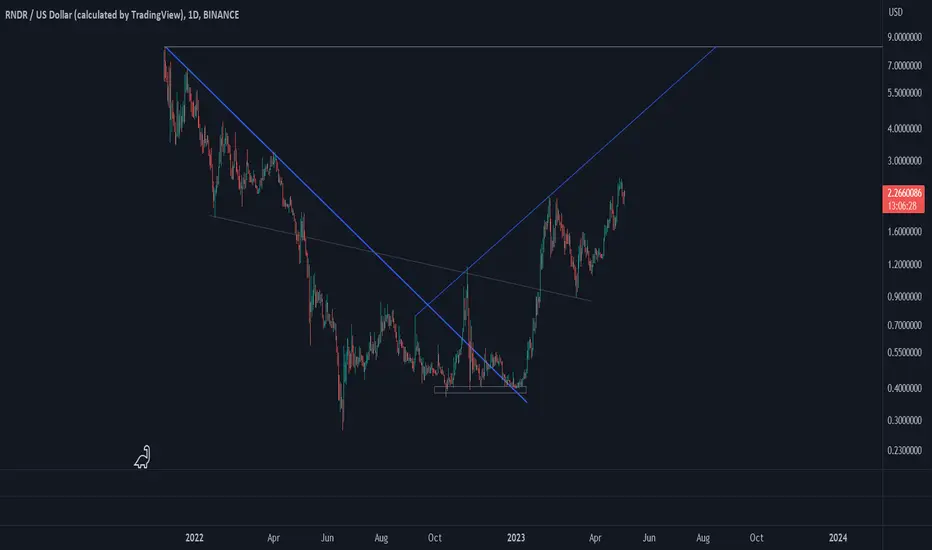
Render Token (RNDR)Render Token is an innovative project of sharing GPU computing power for consumers such as artists and graphic designers. At first, like many projects, RNDR price went down. After the downward move ended and price broke the downtrend line, an impulse upward wave started and price value increased significantly. It is possible an inverted harmonic pattern is forming; have to wait for the price to reach the previous highest high (horizontal line).