RENDER Buy Opportunity, Short now!Please refer to the chart. This explain and shows where price is most likely going towards. The gray box is the point of interest to really drop heavy into the coin and expect to hold for a ATH and longer. I believe price can reach $50 before summer/end of summer. Ill will update this analysis in the comments later.
RNDRUSD trade ideas

Render: Is it down from here, or up?The long-term trend line says it's up, having touched the trend line this afternoon. However, there is also a short-term down channel formation.

Re-Analyzing The Rocket PumpSo yeah that 13% drop was kinda rough and although I'm not worried about it as the market is still to grow I don't wanna be stuck on a long sideways trend when I could be finding other rockets. So here is a better idea of what's going on right now. My main point is watch if this thing bounces off the SMMA and the volatility will swing into buyers favors.

RNDRUSDT Breakout of rising wedge... future predictionBreakout of rising wedge=typically an exact clone of the previous breakout move

Going for itPrevious Doji reversal didn't do much to the resistance now the second low Doji took off with momentum. I see extreme momentum to reach a 30-40%.
This is not financial advise only technical analyst details.

RNDR (BULLISH ASCENDING TRIANGLE)!!!!when viewed from the chart above, it indicates that the RNDR crypto asset is currently experiencing a strong upward trend (bullish ascending). If the price of RNDR manages to break the resistance level at $12.8, it is likely that there will be further gains. The potential price target after the breakout is between $15 to $20. This suggests that there are significant profit opportunities for traders who choose to buy or hold RNDR at this time, with considerable short-term profit potential if market conditions continue as expected. However, as with all crypto trading, there is a risk of loss that should be carefully considered. Therefore, traders are advised to conduct further analysis before making any trading decisions.

RNDR (BULLISH ASCENDING TRIANGLE)!!!!The trading description of the statement "RNDR bullish ascending, if break from $12.8 possible to $15 - $20" is as follows:
The statement indicates that the crypto asset RNDR is currently experiencing a strong upward trend (bullish ascending). If the price of RNDR successfully breaks through the resistance level at $12.8, there is a high likelihood of further increase. The potential price target after the breakout is between $15 to $20. This suggests that there is a significant opportunity for profit for traders who choose to buy or hold RNDR at this time, with a considerable potential for short-term gains if market conditions continue as expected. However, as with all crypto trading, there are risks of losses that should be carefully considered. Therefore, traders are advised to conduct further analysis before making trading decisions.

Render #RNDR - Big pattern Big target --- heading to over $30Rndr is in price discovery
Rndr is in the right sector #AI
I can't catch all the ticker's theres way too many
help me out and suggest new altcoins for me to look at..
Anyway
Still lot's left on the table in terms of gains
Even just buying Spot.
RNDR ready for another push?KRAKEN:RNDRUSD is the hottest AI token right now. This retest of the 0.382 over night, the recent peak in the detrend price oscillator, and the composite index turning upward from a correction suggest that momentum carries us higher before exhausting.

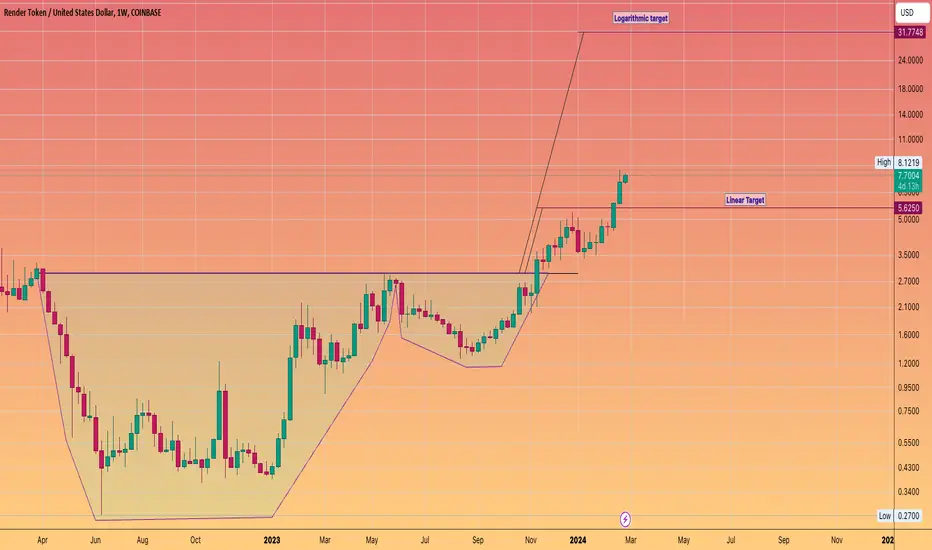
RNDR token huge cup and handle rallye on 1WRNDR token has formed a huge cup and handle formation. It reached the target 1, closing @ 5.21 for the "handle" delpth. Long term until EO 2024 it can close @ 25.65 based on "cup" depth and finalizing the bull run with new ATH.

Bullish RSI divergence on RNDR on 4HBullish divergence is observed on 4H for RNDR token. Will RNDR continue the bullish momentum?

Render about to have a BREAKOUT?Everything is positive for render on all indicators on all time-frames just about. Uptrend with possible break of resistance, looks like a breakout.

RNDRUSD Expecting a technical pull-back.Render Token (RNDRUSD) gave us the bullish break-out we were looking for to buy on our last analysis (August 24 2023, see chart below) as the 1W MA50 comfortably held and provided the rebound that hit our Target:
The price had a strong rejection on the Diverging Higher Highs trend-line of the 1-year Channel Up since and is currently on the 1D MA50 (blue trend-line). The 1D RSI is replicating the June 2023 sequence so it is quite probable to get one last pull-back towards the 1D MA200 (orange trend-line) - 1W MA50 (red trend-line) Support Zone before a new rally. Target between 3.000 - 2.800.
-------------------------------------------------------------------------------
** Please LIKE 👍, FOLLOW ✅, SHARE 🙌 and COMMENT ✍ if you enjoy this idea! Also share your ideas and charts in the comments section below! This is best way to keep it relevant, support us, keep the content here free and allow the idea to reach as many people as possible. **
-------------------------------------------------------------------------------
💸💸💸💸💸💸
👇 👇 👇 👇 👇 👇

Breakout Trade (Update)RNDR sill looking very strong. I'm expecting this to stay over the $5 range soon. It has been strong and steady which is vey good though.

RNDR/USDTCRYPTOCAP:RNDR the coin you just keep missing out on, and one of my biggest altcoin bags!
We have new supports and new resistance levels, bearish pattern invalidated!
once we crack that orange resistance line, I am expecting a new ATH in price!


Don't sleep On RenderRender is looking very strong. Volume is staying high. Once it breaks $5.00 it will hit $6.00 easily. This is a good hold long or short term. DISCLOUSER I have been holding this for a while & haven't taken any profits. I'm adding more at these levels. long term I'm looking at 10-15 dollar target. NFA, risk management & DYOR.
This idea is my opinion and thoughts.

RNDR ready for the next leg.Been posting about this fractal for about 2 months now and it is playing out. If you bought RNDR when i called it out, you would be up about 3x right now.

RNDR fractal playing out as expected.RNDR fractal playing out as expected. Breakout probably next weak. Towards the 5$ area.

RNDR/USDCRYPTOCAP:RNDR set alerts on blue resistance line and green resistance line, because after we break both of them resistances, CRYPTOCAP:RNDR will be looking at making a new ATH in price, then we will need to start using fibs so we can aim higher!

Render (RNDR) Price Correlated to Bitcoin Surge
The price chart for Render shows a sustained upward trajectory, with the asset increasing in value by 200% over the past three months. RNDR's performance has been partly influenced by its correlation with Bitcoin, contributing to a 131% rise since October 16.
As of now, RNDR is fluctuating between a support level of $3.5 and a resistance zone ranging from $3.86 to $4.00. The most likely scenario is a continuation of this upward trend, potentially reaching a new yearly high. In the near term, Render could test and potentially surpass the $4.2 level, further validating the buying momentum.
Should there be a short-term decrease, RNDR might approach the support area between $3.2 and $3.4 and test the $3 mark. A transition to a downtrend could be on the horizon if the RNDR price firmly settles below $2.2.
