Just For Future ReferenceJust For Future Reference
Just For Future Reference
Just For Future Reference
RNDRUSDT trade ideas

RNDR/USDT SUPER BULLISH If RNDR able to close its weekly candle above $8.80 we will go reach to Targets powerfully.
The next Solana is preparing himself

RNDR cup and fib matchThis is a quick chart post to show where I marked my cup and handle projection, it lands almost directly on this new fib extension I added, math truly is amazing sometimes.

RNDR over-heated on NVDA hypeRNDR just wicked to the 0 fib or starting fib, this is where the retrace drawing from a swing high starts to be drawn. RNDR is simply carried along by NVDA hype here as the rest of the alt market goes sideways for the most part. I expect a pullback at some point, this bubble has to pop somewhere. Selling 10% is a win win here because I lock in gains, and I have a large bag left for my future thesis projections.
- I have sold 10% of my long-term position here, this covered my entire initial position.
-next target 17$ I will sell 25% of my position

NVDA in the crypto - RNDROpenAI’s SORA ignited the AI sector in various markets last week. Yesterday, NVDA announced its fourth-quarter financial report. The profit exceeded expectations, and the AI sector in the crypto market rose again.
What we are talking about today is RNDR. This project is a Depin concept project established in 2016, specifically a decentralized GPU solution. There is no direct relationship like WLD and OpenAI. RNDR's strong performance is based on the same GPU business as Nvidia. Although there is currently no RWA business benchmarking US stocks, activist investors like to look for opportunities in tokens in related industries, just like WLD.
However, as one of Alameda Research's investment projects, RNDR also has certain risks. The current M.Cap of RNDR is US$2.926b, ranking second in the AI category announced by CMC.
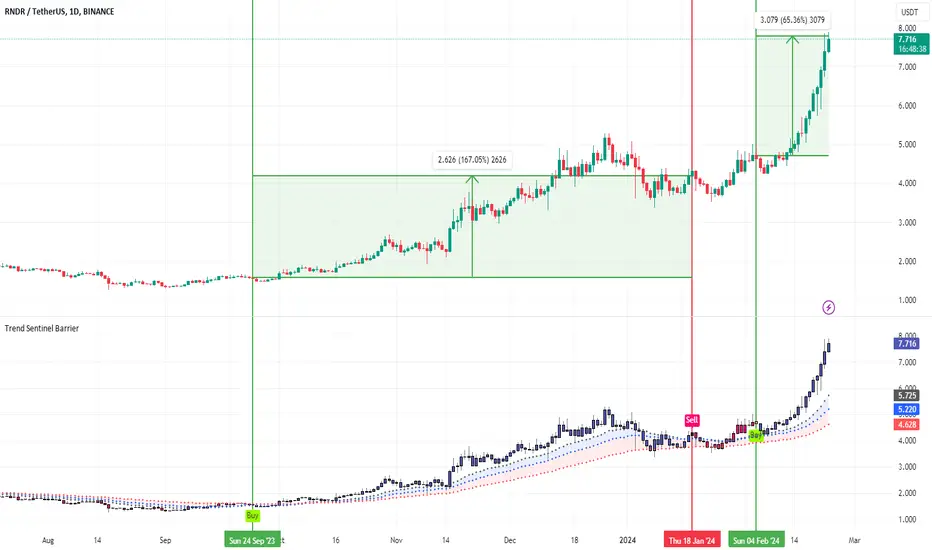
From a technical analysis perspective, RNDR remains in a strong, bullish trend. As early as September 24, 2023, the TSB indicator prompted a BUY signal, and on January 18, 2024, a SELL signal appeared during the fluctuation, with the gains increasing by 167.05%, almost remaining above the wavy area of the indicator during the period. After the fluctuation ended, RNDR started its second round of rise again, while the TSB indicator prompted a BUY signal on February 4, with the current increase being 65%.
Introduction to indicators:
Trend Sentinel Barrier (TSB) is a trend indicator, using AI algorithm to calculate the cumulative trading volume of bulls and bears, identify trend direction and opportunities, and calculate short-term average cost in combination with changes of turnover ratio in multi-period trends, so as to grasp the profit from the trend more effectively without being cheated.
KDMM (KD Momentum Matrix) is not only a momentum indicator, but also a short-term indicator. It divides the movement of the candle into long and short term trends, as well as bullish and bearish momentum. It identifies the points where the bullish and bearish momentum increases and weakens, and effectively capture profits.
Disclaimer: Nothing in the script constitutes investment advice. The script objectively expounded the market situation and should not be construed as an offer to sell or an invitation to buy any cryptocurrencies.
Any decisions made based on the information contained in the script are your sole responsibility. Any investments made or to be made shall be with your independent analyses based on your financial situation and objectives.
RNDR Navigating Virtual Reality Boom with 360% Upside PotentialToday, our focus is on RNDR coin, a potential powerhouse in the long-term landscape. Given the rapid advancements in Virtual Reality technology and the expanding marketplace, RNDR stands poised to play a pivotal role, potentially leading to a meteoric rise in its value over the years. While the long-term outlook is promising, let's delve into the potential price perspectives for the next 3-6 months.
To kick things off, RNDR has solidified a robust uptrend, with each preceding supply area seamlessly transitioning into a demand zone. Notably, RNDRUSDT recently breached the resistance uptrend trendline, signaling an intensified bullish pressure. For the upcoming months, our attention turns to three key resistance levels determined by the Fibonacci retracement indicator.
The initial hurdle, the 361.8% Fibonacci level, could catapult RNDR by an impressive 140%.
The second, more significant challenge lies at the 561.8% Fibonacci level, promising an enormous 250% growth.
The pinnacle of this bullish cycle rests at the 761.8% Fibonacci level, translating to an astounding 360% surge from the latest demand zone.
In summary, RNDR's future appears exceptionally optimistic, and we remain vigilant, closely monitoring this coin's trajectory.

RNDR reached our targetRNDR was hold the Daily Inversion FVG the red rectangle which acted as support and made RNDR to have a huge pump.
●RNDR can easily go for 3 digits in the coming bull market.
●For now let's wait for the next opportunity to buy RNDR for those who missed it.
But those who bought it are enjoying the profit.

RNDR cup from the godsRNDR is forming a cup and handle from its launch date to now. The token has extreme momentum and the NVDA earnings should pump the entire market. We are close to price discovery here, I would love a small pull back and consolidation before this cup launches, the upside is gigantic.
My price targets remain the same from when RNDR was 50 cents:
-Medium Term 17$
-Long Term 40$

RENDERIf you found this analysis helpful or support my work, consider making a donation via Binance Pay: 57841095
Thank you for your support! 🙏💰

RNDR is Ready to Explode !RNDR is an uptrend for a while and actually, it hasn't even gave the value it's supposed to give.
What do we have ? Let's discuss:
RNDR will pump more after a small correction according to Elliot wave theory. We are currently in wave 3. But inside that wave three we are about the see corrective wave known as A-B-C .
After the C ends, it will start a new uptrend with a 5 small waves. Because the main trend is going up.
+Nvidia is about the make an operation based on these kinds of products and RNDR is a partner of Nvidia. It can also help the price to pump more.
According to my analysis, RNDR should go 6.5 at least. Of course it's for only wave 3. After correction wave 4, we can expect more.
If you are willing to invest on this product, I'd not suggest to use leverage. There is already high potential gain and no need to risk it with leverage incase of an event after some bad news.
I'll share updates about this one often so you better keep up!
Good luck to us all.

RNDR about to all-time-highRNDR has one final area after this most recent price target before price discovery. The token hit my price target and there is a final area of interest at 6.9. Once we reach all-time-high, this token will become harder to chart. With the ai hype phase and RNDR moving to Solana my long term targets of 17$ then 40$ still remain, just have to be patient.

RNDR mid term 📌 analysis ⏰Pls 🙏 DO your own research 🔎 it's just my opinion
It's spot wallet not leverage trade 📌
It's just scalping High risk reward one 🕐 so I use 2% of my portfolio 💰
Buy :-: yellow 🟡 30% & 70% on chart 📉📈
Sell <•> GREEN 💚 50% & 50% on chart 📉📈
Stop 🛑 ( i recommend complete day below )

Render completed a setup for the next pumpHi dear friends, hope you are well and welcome to the new trade setup of Render Token (RNDR) with US Dollar pair.
Previously we caught a almost 111% pump of RNDR as below:
Now on a 2-hr time frame, RNDR has formed a bullish AB=CD move for the next pump.
Note: Above idea is for educational purpose only. It is advised to diversify and strictly follow the stop loss, and don't get stuck with trade.

🚀🔬 RNDR Analysis - Testing Heights! 📈💡📈 Technical Overview:
RNDR: Testing the top of the range support level at $4.40.
Potential opportunity for a long trade.
Consider taking profits at $5.00 - $5.30 and then at $6.00 - $6.50.
Place the stop loss just below the lower support level, around $4.18.
📊 Trade Strategy:
Trade Opportunity: Long trade.
Profit Targets: $5.00 - $5.30, $6.00 - $6.50.
Stop Loss: Below the lower support level, approximately at $4.18.
🚨 Note: Market dynamics may influence outcomes.
Scaling heights! 🚀📈 #RNDR #TradeAnalysis 🌐✨

RNDR will likely exhibit bullish movement.RNDR is currently processing inside the premium zone. Once it enters the discount zone, it will take the IDM and then confirm the current High, which is not confirmed yet. If it enters the discount zone by confirming the High, keep an eye on the marked two OB. It will likely exhibit bullish movement.

RNDR ready for pump or dump?RNDR hodling the Red Rectangle ( Daily IFVG ) is Bullish for RNDR.
●Losing this Red rectangle will take RNDR down towards $3.3 level.
●Holding the Red rectangle will take RNDR up towards $5.280.

RNDR idea played outIt looks like my RNDR idea for a breakout played out nicely to the day. I was hoping for the same on INJ but that pump fell short after a few days. With NVDA strength I expect RNDR to keep pumping. Maybe a test of that golden Fib for support then a test of the teal line that converges with the next fib ~5$.

RNDR - 1W - $20 - increase of 350% possibleRNDR is looking really good. On the 1 day time frame there is only one resistance level left which will be soon broken. On the Weekly time frame RNDR can go straight to $20 which is increase of approx. 350% profit.

RNDR longA correction to major bullish trend stopped around Fibonacci 0.5 level. A continuation of ascending trend to 1 Fibonacci level is expected to happen.

Bearish on $RNDR1. We hit Daily M.T/ Wick C.E Premium
2. We are above daily mean threshold.
3. We have draw on liquidity as tp1, tp2 tp3

RNDRUSDT Bullish Gartley Retrospective review on a harmonic pattern entry.
The gartley is a well known continuation pattern , ideal for lower risk higher reward entries in an already established trend .
We can see an initial reaction from the 61.8% retracement but the bulls fail to break a new high, this allows the bears to push price down to a lower level , the 78.6%.

Rndr takes golden fibAt long last rndr takes the golden fib, a key trend is pushed on the teal line. I expect 5$ today. And 5.4 soon after. We will reach price discovery sooner than you think.

RNDRUSDT.Pby dividing my asset into two equal parts, i have placed two pending orders on the shown levels
