Render's Rally ending? Trading Insights & Retrace AspectsThe rally in Render appears to be reaching its conclusion. Over the past few months, Render has been an intriguing trading token, outperforming BTC by surging from 0.9 to its monthly resistance level of 2.93 (Bybit).
Based on my wave count analysis, it seems that we are approaching the end of the rally at this resistance point. I observe a potential ending diagonal pattern, consisting of a fifth wave within a fifth wave within a fifth wave, characterized by declining volume. A final upward push towards the monthly resistance, accompanied by RSI divergence, could serve as a short trigger. Alternatively, a more cautious approach would be to wait for the breach of the extreme point of wave 3 within the ending diagonal.
If a retracement occurs, the target could be a return to the previous fourth wave of a lower degree. This area coincides with a monthly resistance level, Fibonacci 0.618 retracement level, and the fixed range point of control for wave 4 according to my highest count degree.
In conclusion, the success of this swing trade will depend on the extent of the upward movement before encountering divergences or a reversal. If realized, this trade has the potential for a risk-to-reward ratio of approximately 3.85.
I will closely monitor Render for further signs of weakness, which could present a short-selling opportunity, or to observe if it breaks through the monthly support level accompanied by notable volume
RNDRUSDT trade ideas

RNDR ( mid - long term hold ) RNDR ( mid - long term hold )
Market Cap: 1B
Category: AI
Target 1: 3.9079
Target 2: 4.8257
Target 3: 5.8423
Stop Loss: 2.4819
( if you get stopped out ... re-enter on 2.6231 level )
Manage Risk - have a stop loss in place
Not Financial Advice
This is for Entertainment Only

RNDRUSDT at support and may head to 2.78 zoneNow since the price is at support, a long is favorable here. I expect the price to march up at least till 2.78 area.

RNDR - falling from the skiessignificant clean trend wall resistance increases the probability of a possible correction towards inefficient price action area.

RNDR-USDT: Potential Trendline Fakeout and Retracement?
The RNDR-USDT trading pair is currently exhibiting a pattern of higher highs, suggesting a positive trend. However, traders should be cautious of a potential trendline fakeout within the range of 2.956 to 2.970. It's crucial to closely monitor the price action as it approaches this level, as a break below the trendline could indicate a shift in momentum.
Furthermore, there is a possibility of a correction in the market, with potential support levels in the range of 2.250 to 2.350. Traders should be prepared for a potential pullback in price within this range.
Traders should closely observe the price movement and wait for confirmation before making any trading decisions.
#plan your trades and trade your plans.

RNDRUSDT at 4h resistance, long favorable from 4h supportThe price is currently trading inside the 4h resistance zone and I expect it to come back to the 4h support zone. The support is not that strong but I still think that a long is favorable from there. Lets try this long if the price retraces till that support level.

RNDRThe price continues its uptrend after forming the cup and handle pattern. Each new peak forms a bearish RSI divergence. The price is currently in a key resistance zone. Additionally, a wedge pattern has formed. The weekly 50 EMA will be the first significant support level in case of a correction. A break below the lower boundary of the wedge will signal a trend reversal.

RNDRUSDT to bounce from daily support to 2.54 and 2.63The price has touched the daily support and already bouncing from there. I expect the price to bounce higher and therefore favoring a long trade. I expect it to move to 2.54 first and then to 2.63 next.

RNDR Support Bounce Long SetupRules met to enter:
Price has nicely previously bounced from our support levels. Price is above VWAP. We attempt to enter on the previously lowest wick in the support zone. SL is placed below VWAP and TP is calculated using a 4:1 Ratio base day on our SL.

Rndr usdt short Every top is an opportunity to open a short position.
Your own risk
Your likes and comments are not important

RNDRUSDT SCALPING ANALYSISAS you can see RNDR is in a up trend.
I will wait on RNDR to break down from the up trend and when it open closes under I will open a short

Render $RNDR 4H TimeframeRender Bulls are working hard to push through resistance. For entry be patient and look for base contraction. Stay safe and set your stop loss.

RNDR 4H UPI'm gonna scalp this with a small SL because the support is clear for me. On 1W this can have a really good tragets. If you need a confirmation might wait for 2,4 break out and next 1H candle then put yout own SL and move with the markets.
If you look over 16-17 May, where the support was 1,9 you can see that small SL strategy on RNDR can work pretty well.

RNDR close to a serious resistanceIMPORTANT: this is a short signal but on HTF which means I'm giving the area in which I'd look for a short but doesn't mean I'm telling you to short as soon as price goes there, this is a WEEKLY chart.
RNDR pumped a lot lately but I think the top of this run is almost in. I expect price to reach that DAILY resistance area with weekly RSI being low and then retrace between 30 and 45%. Volume keeps lowering as confirmation of my idea.
Considering the coin is relatively young and the amount of volume since last January, it's clear that best price opportunity to fill your bags and hold is gone. Most bearish scenario would be around 0.822
USDT
but it's likely it won't go below 1.64 unless BTC dumps hard. I still believe we should see BTC dumping because I think that world economy should reflects also on crypto a bit further but I might be wrong.
I'll set an alert for then price reaches the resistance area so that I'll be able to update the signal with a short setup if it's the case.
Good luck

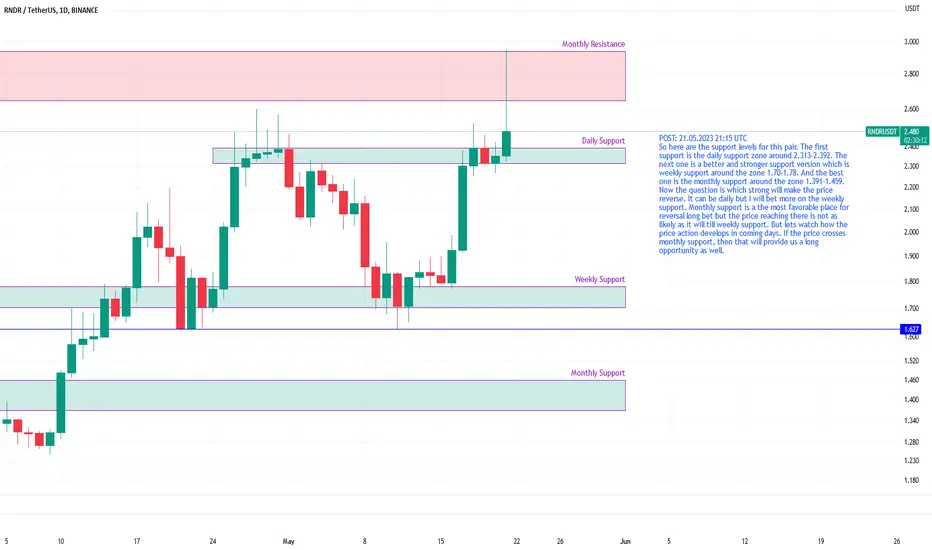
RNDRUSDT likely have reversal from weekly support 1.70-178So here are the support levels for this pair. The first support is the daily support zone around 2.313-2.392. The next one is a better and stronger support version which is weekly support around the zone 1.70-1.78. And the best one is the monthly support around the zone 1.391-1.459. Now the question is which strong will make the price reverse. It can be daily but I will bet more on the weekly support. Monthly support is a the most favorable place for reversal long bet but the price reaching there is not as likely as it will till weekly support. But lets watch how the price action develops in coming days. If the price crosses monthly support, then that will provide us a long opportunity as well.

RNDR: Bullish Trend, Watch $2.520 ResistanceRNDR is showing a strong bullish trend. The price has increased by 8% in the past 24 hours and currently sits at $2.502, above the middle Bollinger Band of $2.373, indicating the bullish momentum.
The Fibonacci retracement levels also offer key price levels. Currently, the price is near the 1 Fibonacci level of $2.520, which could act as a resistance level. Breaking this could see further price increases. On the lower side, the 0 and 0.5 Fibonacci levels at $2.267 and $2.394, respectively can act as potential support levels in the event of a price drop.
Your Relative Strength Index (RSI) is currently at 73, which typically suggests that the asset might be overbought. This can sometimes indicate a forthcoming price correction, but it isn't a guarantee.
On the other hand, the Moving Average Convergence Divergence (MACD) of 0.083 and the Stochastic Oscillators at 35 both suggest a continuing bullish trend. These are positive signs that the upward price movement isn't over yet.
The volume oscillator at 52% shows a good amount of trading volume, backing the current price trend. Meanwhile, the On-Balance-Volume (OBV) of 307M supports the bullish sentiment as it indicates volume is rising with the price.
Finally, the EMA 50 at $2.085 acts as solid support. If the price were to fall, it's likely to find strong buying interest around this level.
In summary, the trend for RNDR is currently bullish, with key resistance at the $2.520 mark and solid support around the EMA 50 at $2.085. Always remember to keep an eye on volume and momentum indicators to anticipate any changes in the trend.
Given the provided indicators, the overall trend for RNDR appears to be bullish, suggesting that the price may continue to go up in the short term. Here's why:
The price of RNDR has risen 8% in the last 24 hours, showing positive momentum.
The MACD at 0.083 also indicates a bullish trend, suggesting a continued price rise.
The Stochastic Oscillator is at 35. A value below 20 often indicates an oversold market condition, suggesting upward pressure on price, and since it's above 20 but below 80, there's room for more upward movement.
The Volume Oscillator and OBV indicate that the volume is accompanying the price rise, which often strengthens the trend.
The current price is above the EMA 50 and middle Bollinger Band, both bullish signs.
However, caution is warranted as the RSI is at 73, indicating that the coin is currently in overbought territory, which may lead to a possible price correction in the future. Also, remember that the 1 Fibonacci level at $2.520 might serve as a resistance point.

RNDRUSDT heading for monthly resistance zone 2.645-2.939I believe this is heading for the monthly resistance which is lying in the zone 2.645-2.939. Once its hits that range, it is likely the price will be pushed back from there. And might head down to look for a strong support. But lets watch first the price move to the monthly resistance.

RNDRUSDT may head upto around 2.70The price has been pushed back down by the monthly resistance. The drop was intense and made the price drop significantly. But I see an opportunity to long at this level with a target around 2.70.

RNDR - Breakout
Hi Folks,
RNDR is still well orientated.
Let's follow through and monitor the trend following.
Amongst the TOP 100 crypto, RNDR have pump the most this week, seems to be the strongest presently.
It seems there is a partnership with Apple and the VR/AR headset with Apple.

RNDR We want some More Money#Rndr breakout of the trendline testing it consolidating- we taking some profit at 2.56 and then we taking some profit at 2.75
I come to give d people, is it because I have no followers, I post 3 trades and all 3 pump.
Move stop to entry after tp1 Stop - 2.18,
Leverage whatever your heart desire- cross margin is best no more than 1/10 of balance in Position
Find order chaos will follow

RNDRUSDTOverall market structure for this pair is bearish
first entry picked already second entry is entry after that draw has been taken.
but before that there is a buy entry to our sell entry

RENDER $RNDR Token Move AssessmentThree head divergence. Possible pull back to 1.85 before heading higher.
