Render Token Long Term StrategyHi folks,
Let's look at what Render Token is
🏳️Render Token is a project token focused on blockchain technology and cryptocurrencies. Render Token (RNDR) is an ERC-20 token developed and distributed by a company called OTOY.
🏳️Render Token serves as a payment unit for the distribution of 3D graphics, virtual reality experiences, and cloud-based computing power. RNDR enables users to share their computing power while allowing token holders to receive payment in return for this computing power. Thus, those sharing their computing power earn more Render Tokens, while token holders make payments to utilize this computing power for rendering 3D graphics or other computationally intensive tasks.
🏳️Render Token holds significant value for professionals and companies in 3D graphics and virtual reality fields. By using this token, individuals and organizations in need of computing power can access more resources and render complex graphics faster. At the same time, token holders can earn passive income by providing their computing power.
🏳️Being an Ethereum-based token, Render Token operates on the Ethereum network. This ensures fast and low-cost transactions for the token. Render Token is also listed on exchanges, allowing token holders to exchange it with other cryptocurrencies.
Bonus Chart 1: Wide Angle
Technical Data
🎯Orange --> EMA50 --> 1,86 (support)
🎯Blue --> EMA200 --> 1,38 (emergency call)
🎯Accumulation Zone (FRVP) --> 0,37 - 0,67
🎯Fib 0,236 --> 2,01 --> Support no:1
🎯Fib 0,328 --> 3,05 --> Next target
🎯There is negative divergence on the table (if it's approved), we can see testing EMA50, even EMA200. If you're a short-term player, keep that in your mind.
🎯In the worst-case scenario we can see 1,46 (perfect time to buy for the long term).
Bonus Information
🏳️RNDR is now only listed by Binance, Kucoin, and Coinbase (we can expect further listing).
🏳️Max supply --> 536,870,912.
🏳️Circulationg Supply --> 363,911,539 (%68).
Bonus Chart 2: Google Trends AI, Bitcoin, and Metaverse
🏳️Blue one is AI. When we checked Google trends for the last 5 years, AI is surpassing both BTC and Metaverse. Let's imagine! What will happen AI projects in the next bull run?
Thanks for reading all mates, do not forget to hit the like button.
RNDRUSDT trade ideas

Rnder 0n a rampage to explore the down side, after the break out of my trendline and made a retest to the downside

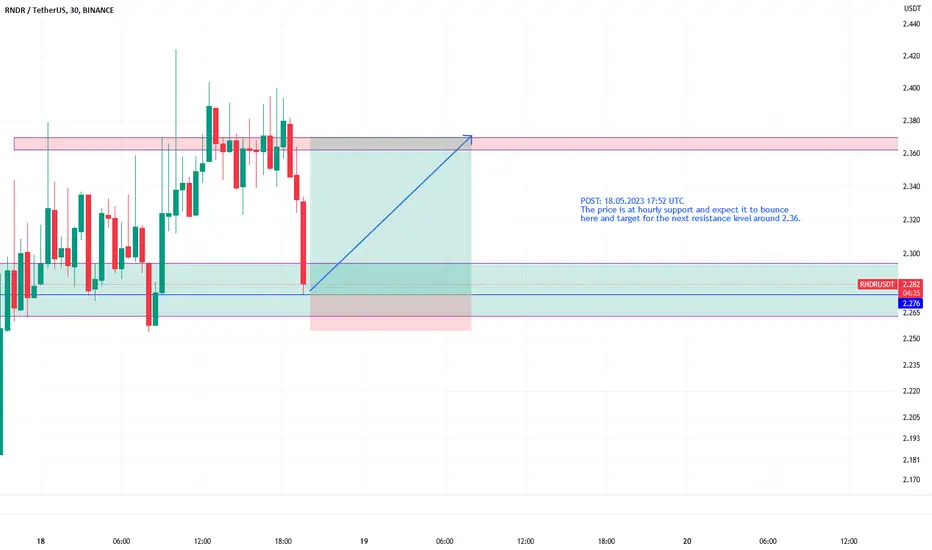
RNDRUSDT on support, likely to head to 2.36The price is at hourly support and expect it to bounce here and target for the next resistance level around 2.36.
RR=2 sell idea bearish shark pattern + RSI divergence + double top in formation
PS never risk more than 2% of your capital per trade

Can RNDR Break Through Resistance?RNDR/USDT - Daily Timeframe
RNDR is an interesting asset, a lot of hype around this token.
Price is struggling to overtake current resistance between $2.20 and $2.50.
Price is currently right at resistance right now with a potential Swing-Failure Setup.
We are above the Base Line , and we did just have a nice push with momentum OFF of the Daily Base Line to bring us back up to resistance but I'm not sure about this one.
A Daily Breakout above $2.50 would be nice to see, would definitely chase the momentum. Otherwise - this looks like a side line for me at the moment.

RNDR Coin Price Prediction✅ RNDR COIN PRICE ✅
🔥 Price is at the Resistance Level at around $2.50 🔥
If Breaks up ..
🚀You can target around $3 that's around 20% gains🚀
If Breaks down..
We can expect the price around the $1.60 range.
👉 Follow me for more opportunities.

RNDR - ReboundHi Folks !
Find enclosed the update of the chart for RNDR.
This Crypto is looking quite strong amongst the top 100.
It was time for me to secure a reasonable TP2 (50% of the position) after this rebound of 40%.
Considering the current strength I will keep the remaining in trend following Next Target will around 3.10
Let follow through !

RNDRUSDT(Render Token) Daily tf Range Updated till 18-05-23RNDRUSDT(Render Token) Daily timeframe range. it got some good retail interest now. it already closed above #1.989 and got a clear space till #3.290 but thats possible if the retail interest keeps up. if not than back to #0.951.

RNDR possible HS, It's possible that RNDR is forming a daily HS. Same as bitcoin I expect if this scenario play out that we can get a doos short position.


RNDR breakout a strong break out from the resistance level and is also making HnS targets are mentioned in the charts

RNDRUSDT right on track towards daily resistanceThis level seems to be resisting the price to go up. The price has reverted back on several occasions. But this time could be different and the price may finally be able to move higher. The swing idea of the price reaching to the daily resistance around 2.08-2.12 is still in play. However, I would also consider taking some profit at 2.025 level as marked on the chart.

[Update RNDR] I'm short.Range levels, monthly levels, etc. Don't gonna explain too much. Colors are fine, it is what it is.

RNDR is almost ready for launchSitting on support, RSI looks good, loads of positive volume. Possible targets could be 4$ and ATH.

RNDRUSDT well on its way to first 1.857 and then prob 2.08So the area 1.748 was a good level to book profit and load a bit lower. I think this one is still good for moving up and should not lose the last low. As mentioned again, the next level to watch and book profit for is 1.857.

RNDR TO 1.91Risk taker and market analyst hoping to strike it big in the trading world. Learning, growing, and hustling my way to success."

RNDR USDT . FLYHello, I am known as a famous trader who works in the field of stock market and technical analysis. My experience in this field is very valuable due to accurate analysis and examination of market conditions.
I use technical analysis methods to predict market behavior. To do this, I use various price and volume charts as well as different technical indicators. With these methods, I am able to predict market behavior in the future.
I also examine various companies and industries using various analytical methods, including fundamental analysis. This method allows me to approach different industries and companies with the best perspective for investing and trading in the stock market.
With the experience and knowledge I have in the field of market analysis, I can help you make the best decisions in the stock market and become a successful investor.

RNDRUSDT long from 1.628 up to 1.699As mentioned in the update of the previous post, level around 1.628 was for long. So the trade idea here with the chart. I believe its going higher but first resistance it will face around 1.699. Lets target that first.

Possible Buy IdeaOnce StochRSI hits bottom of triangle looking to add to position. I am a buying when there's blood in the streets.

RNDRUSDT moving up nicely and targeting daily resistanceIf long from the bottom of the support zone as suggested in the last post and several updates, reducing some size at 1.857 will not be a bad idea. I believe there will be an opportunity to add the size a bit lower from there. Anyways the swing trade to daily resistance remains valid. However, such reducing and increasing the size allows to benefit from the lower time frame movements.

RNDR ANALYSIS - OUTLOOKCurrently RNRD Looks like will break the trendline after volatility one day before, we expecting that the price movement will touch the SND or SNR Flop at the red zone "expecting the reaction here".
then will move up to get the liquidity before continue goes down to discount area

RNDRUSDT may have a good bounce from weekly supportThis one seems to be heading for weekly support around 1.70-1.78. That is a zone good for long opportunity. That zone is still 6-10% away from the current price. But if it reaches there, a long would be favorable for a swing trade towards the daily resistance around 2.08-2.12.
