"Ronin (RON) Gearing Up for a Massive Reversal – $10 in Sight?" The chart of Ronin (RON/USD) shows key technical levels and indicators suggesting a potential reversal from the current order block zone. Here's a structured analysis:
1. Current Market Structure & Order Block Potential
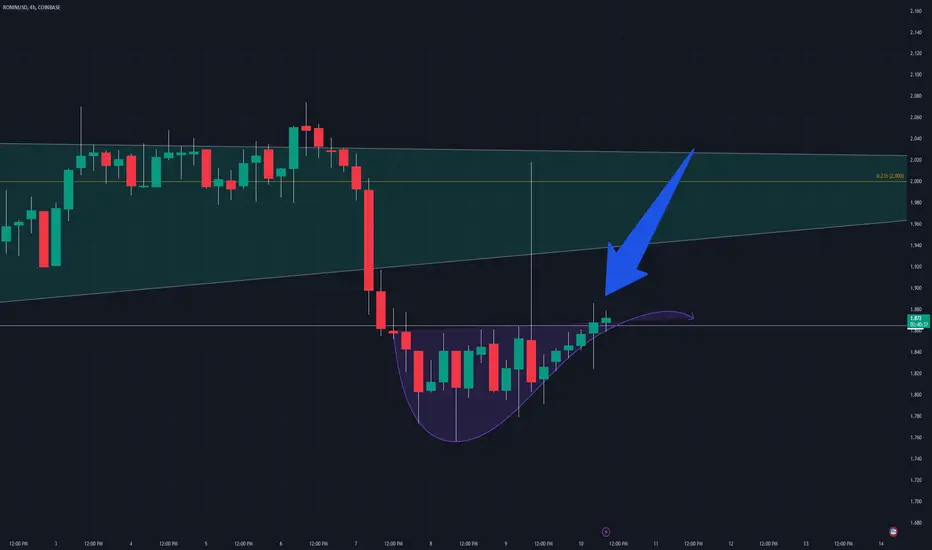
Price: $1.619 (as per the chart)
Support Zone: Around $1.50–$1.60, marked by a blue order block, indicating a potential demand area.
Resistance Levels:
$2.00 (200 EMA resistance)
$2.50 (previous liquidity zone)
$3.50 & $4.50 (major resistance levels)
Above $4.50, the price could experience strong upside momentum towards $8 or even $10.
2. Moving Averages (EMA)
50 EMA (yellow) at $1.833: Currently acting as resistance.
200 EMA (pink) at $2.005: A crucial breakout level for confirming a bullish reversal.
3. RSI (Relative Strength Index)
Current RSI: ~39.78 (neutral to slightly bearish).
Oversold Region (~30 RSI) is close, suggesting a potential bounce.
Confirmation: RSI crossing above 50 will signal strength in momentum.
4. Key Triggers for Bullish Reversal
✅ Rebound from the current order block (~$1.50–$1.60)
✅ Break and hold above 50 EMA ($1.83) and 200 EMA ($2.00)
✅ Volume increase to confirm buying interest
✅ RSI pushing above 50-60 range
5. Potential Targets & Pathway
1️⃣ Short-term target: $2.00 (EMA 200 resistance)
2️⃣ Mid-term: $2.50 and $3.50 (historical liquidity zones)
3️⃣ Long-term: $4.50 (breakout level, unlocking $8–$10 potential)
Final Thoughts
If the order block holds, we could see a bullish reversal leading to higher highs.
A break below $1.50 may invalidate this setup, leading to a bearish continuation.
Volume confirmation and market sentiment will play a key role.
RONUSD trade ideas

RON-gamingI'm a big believer in companies who love engaging with communities, and players. Everything I've seen Ronin do is amazing, from Axis to Pixels. I'm mad that i found out about those games late but there is still a lot more to come. I've been playing a lot of games on Telegram for airdrops based on the Ronin chain.
Looks like an ascending scallop in the 4hr trying to bound back into the triangle which is breaking. Showing bullish signals. New stuff coming to Ronin, don't be late.
RON BullishRon looks great, starting to head to the upside. It's time to remove the squares and mark profit targets. Drop below what you would sell RON at.

RONINClose above 2$ mark will probably lead to price rally in the following weeks. Solid project that has been through the bear market and looks healthy asf , but obviously DYOR

RoninSimilar to a few other projects, Ronin's chart shows a break of trend (yellow line) and has put in a Higher High (HH). Hopefully we get a chance to put in a good long if there is a retest of support at 1.45 or the 50 day SMA at 1.50.
Invalidation would mean not getting a Higher Low (1.30), or you could be safer with a SL below the 11 month low of 1.20. This coincided with the 782 retracement Fib as shown. Since then it has consolidated sideways for a few months and may have coiled enough to reach new highs.
The obvious first target would be the 200 day SMA and the 3 month high - both around 1.94, but I'm going with low leverage, so can / need / want to be a bit greedy.
TP1 planned to be at major level of support at 2.38 which flipped into resistance and capped the July surge. TP2 is 3.20 which is the 618 return FIB (or even 3.50 if there is momentum).
TP3 assumes gaming is trending strongly and unlocks don't oversupply the market, and is an ambitious 6.45 (the 1.618 Fib for lack of trade history as the ATH is 4.50, and this is a young project).
Happy to hear alternate points of view...

RONUSD Pull-back expected.Ronin (RONUSD) hit the top (Higher Highs trend-line) of the 1-year Channel Up. This is the 2nd Bullish Leg of the pattern and is technically expected to peak at +635%, same as the April 10 2023 Higher High. We expect at least a -47.27% decline towards the 1D MA100 (red trend-line), targeting 1.5000.
-------------------------------------------------------------------------------
** Please LIKE 👍, FOLLOW ✅, SHARE 🙌 and COMMENT ✍ if you enjoy this idea! Also share your ideas and charts in the comments section below! This is best way to keep it relevant, support us, keep the content here free and allow the idea to reach as many people as possible. **
-------------------------------------------------------------------------------
💸💸💸💸💸💸
👇 👇 👇 👇 👇 👇

Possible Break Out RONThere is a Trading Signal to Buy in RON
There is also 3 ways this could go, Chart speaks on what to Do whether position Long or Short.
And also you can DYOR. Like is so much appreciated


RONPERPSo here in my chart we can see its bullish because you can see the Orderblock we use is 4hours timeframe and we're going to retest 4.3965 level, we didn't hit that yet even the candle so lets see how this will playout :))
