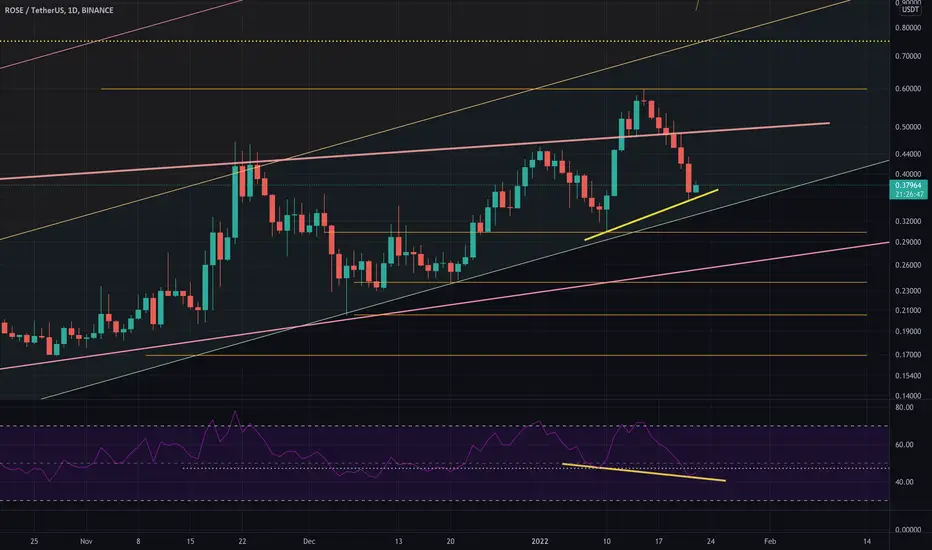
ROSE react the support zone BINANCE:ROSEUSDT
Keep eyes on it 👀🕵️👁️
Don't forget Financial management and step
by step purchasing 💹💰💵💲
Please follow me 🙏🥺
Please leave comments 🗨️💬
Like and share with your friends 👍💑
I hope you enjoy ☺️🌈🎉🎊🎁
ROSEUSDT trade ideas

OASIS NETWORK - DIP BUYING TREND - GREEN TREND CYCLEHello trading friends,
Oasis network are still interesting for the long term, even with this breakdown trend.
check or you can find levels for your setups into this coin, and this update means for long term.
_ There is not always a reasons to enter markets directly - study always the trend well.
Have a great day.

ROSE : FALLS WITH BULLISH DIVERGENCEThose Orange, Pink and yellow lines are
supports n resistances // sorry to be messy but every lines matters for short term player :P
This is interesting.
Feel free to comment /share ur ideas
Trade safe & FUn
ROSE : Potential targetROSE : Potential target, Support and resistance on the chart,
(Kindly DYOR on the news about Oasis, metaverse and etc.)
.
Trade safe, Always place your stop loss
Feel free to feedback + comment
.
Mil

ROSE : SUPPORT,RESISTANCE & TARGETRose isn't able to break out resistance and ichimoku cloud is crossing down
it's more likely to move down to the cloud and reach the main ascending support line
This is the area to watch out, if it isn't break down then it would be a good entry point. (Scenario 2)
\
But currently it's been super bullish, if overall market is good then there's possibility that it break up
this rising wedge to the target above as well. Entry point is after break up is confirmed
.Trade safe and fun,
Always place the stop loss :P
.

I ❤️ ROSE - Trading towards price discoveryContinuing my recent focus on ROSE, outlined in the chart is the structure I hope ROSE will hold, which will produce a very bullish bias towards price discovery in the coming weeks. I want to see ROSE retesting that 0.36-0.32 range before breaking upwards. I do not want to see rose trading on the daily below that 0.30-0.27 range, and waiting ergerly for it to break back above the 0.4 minor resistance and test the major purple trend which it has now attempted to break on two significant impulses up - I suspect if it holds this structure the next impulse will be the one which breaks it.
For those who have been following my trading plans with ROSE, this means I will be holding throughout this structure
If BTC runs down to 40k and below in a deep wick and ROSE follows I will be watching for the bounce from 0.23 zone (down to 0.2)
As usual, I will be updating this trade as it progresses updating profit targets and reversals, you can follow the thread for updates

Roseusdt-update🤖EMERGENCY🚑Hi guys❤
Support us by liking
The price gave a good profit to the support line after Polbeck
be careful🌋
Can touch specified levels

ROSE TA PRICE PREDICTIONRose pump surpassing its ATH even when BTC and all the altcoins having red days
despite having its ath, it is slowly showing a fractal movement of bitcoin, and will soon follow the move of bitcoin.
BINANCE:ROSEUSDT


ROSE/USDTROSE/USDT
Just keeping it simple. I think price will bounce off the support line and start to climb.

My suggestion is to avoid buying and sellingWe do not have a proposal until it touches the trend line and shows its behavior in dealing with it

🔥 ROSE Closing In On Major Reversal AreaA while ago I made an analysis where I discussed the ascending wedge pattern of ROSE. In that analysis I wrote that I was expecting ROSE to fall, potentially towards the bottom support of the chart pattern.
Since we've seen some massive bearish pressure over the last couple of days, we're actually quite close to the wedge's support area, see the yellow area. There might be more bearish pressure in the short-term, but I'm expecting ROSE to encounter some serious buying pressure in the yellow area. Keep an eye out for a potential reversal.
Happy trading!

ROSE- Oasis Network H&SROSE- Oasis Network H&S Formed. Expect a fall as per the chart.
Disc: Not a Trading Recommendation. Just for learning purpose.

rose---usdtDue to the formation of the channel and the return of the price from the support area of the channel, we are expected to increase the price as much as the height of the channel.

probably in the next 72hrsim new to trading i just drew some shits on the chart, i hope this will work kek

#ROSE Long Here #ROSE 12H
1) Resistance become Support
2) Fib Retracement 0.5 ($0.45)
3) Ema 21 Support
Fib Extension Target ($0.73)
Many conditions to LONG $ROSE Here.


Roses are redAlready finished wave 3 of 5. I’m expecting a correction to previous highs. Maybe wave1’s peak point. Then we can see 0.9usdt for 5th wave

ROSE TO THE MOONThis is just my idea on the movement of ROSE as regards its trend, MACD and EMA on a 4HTF. All things being equal, MACD is showing a bullish move for rose, this is dependent on the movement of BTC. You can long from 0.45 as we are going to have a strong support from there.

ROSEUSDT Reversing from the major support zone!ROSEUSDT (4h chart) Technical analysis Update
ROSE/USDT currently trading at $0.47
Previous resistance act as a good support for rose.
Buy level: Above $0.465
TP 1: $0.510
TP 2: $0.550
TP 3: $0.590
TP 4: $0.650
Stop loss: $0.430
Max leverage:2x

roseusdtthis is the same line from my last couple calls no adjustments i think mwe may come down a little further and then go sideways for few

ROSE_USDTROSE after complete wave 5 of wave 1 , need correction . wave a of correction is complete and wave b and c is coming . after correction we expect new impulse wave of this gem coin .

ROSEs are red...ROSE is currently testing its 100-day EMA and ~0.455 level. It has also been trading within an ascending channel since December 2021 where it gained ~192%. Naturally, since its ATH it has faced a pullback to its 50% fib level.
ROSE must now decide whether to fall further toward the 38.2 level, which is a common occurrence when BTC is weak, or it can gain momentum and re-test its higher fibs and ultimately its ATH. ROSE has a good risk: reward ratio. If BTC avoids a further fall below the 40k level, ROSE can move up. It is important to wait for confirmation of the trend before entering a trade.
Please note I am not a financial advisor and this is not financial advice. All ideas are for educational purposes only :)
Please feel free to leave your comments and thoughts below!
