🤩We reached the first target 40%_see previous post🤑According to the previous analysis, which was posted on the same page, it touched the price of the first target by breaking the price box. Save profit is reasonable for a short time.🤑🤑💜🤍
ROSEUSDT trade ideas

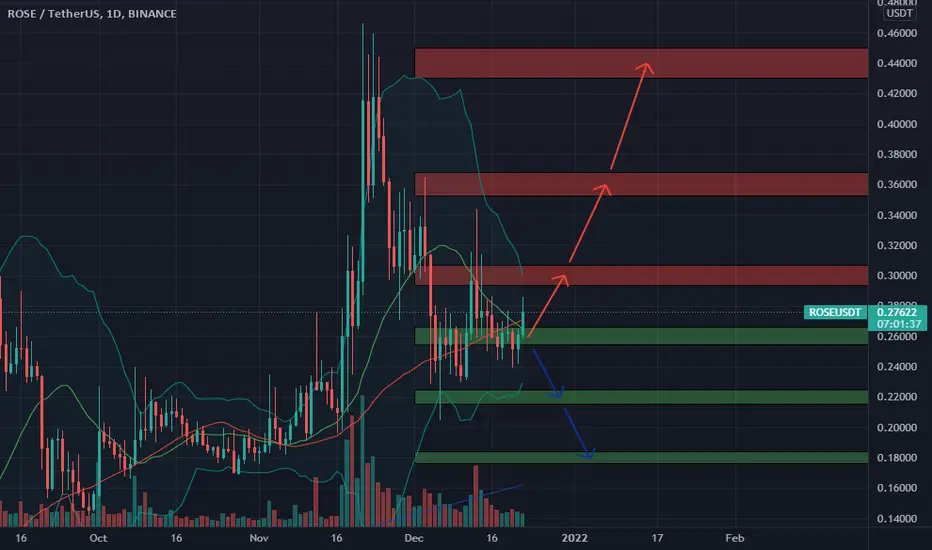
🆓Oasis Network (ROSE) Dec-22 #ROSE $ROSE
.
📈RED PLAN
♻️Condition : If 1-Day closes ABOVE 0.26$ zone
🔴Buy : 0.26
🔴Sell : 0.3 - 0.36 - 0.44
📈BLUE PLAN
♻️Condition : If 1-Day closes BELOW 0.26$ zone
🔵Sell : 0.26
🔵Buy : 0.22 - 0.18
❓Details
🚫Stoploss for Long : 10%
🚫Stoploss for Short : 5%
📈Red Arrow : Main Direction as RED PLAN
📉Blue Arrow : Back-Up Direction as BLUE PLAN
🟩Green zone : Support zone as BUY section
🟥Red zone : Resistance zone as SELL section
Wait for RSI & Get a 160% Easy ProfitROSE digital currency has formed a negative hidden divergence in its price and RSI indicator.
However, according to the market situation, if it can suffer in the same range in the form of trading for a while, it can enter a bullish rally to the specified range by breaking the RSI downtrend line.
Purchasing in the red box is considered low risk and can be done as close to 20 cents as possible, and then in areas above 50 cents to exit the step and identify profits.
Please enter into transactions according to the market situation by observing capital management and risk management, so that in case of re-correction of market prices and bitcoins, you can reduce your average purchase at low prices.

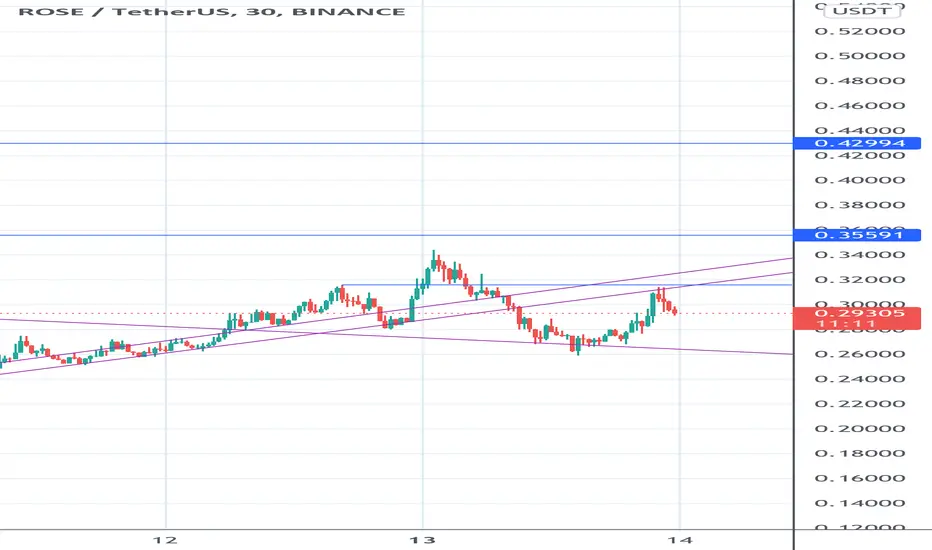
OASIS ROSE - Still bullish!! $0.42 next?? - Market Update Dec 21While the entire crypto market suffered a huge blow due to the BTC crash, ROSE has maintained a very unique and bullish structure, despite the astonishing yet not surprising -63% drop. ROSE had a quick wick down to $0.17, but since then recovered very nicely.
For support, ROSE's most significant level of support is the steep diagonal trendline that started back in July. This is a pretty unique phenomenon and I am personally amazed it has held this well. Though not granted to hold forever, there is a very strong chance we shouldn't see anymore significant downside. This trendline should hold, barring a catastrophic BTC crash.
For resistance, we first have the the 50 Daily MA coming in at about $0.27. Then $0.30 (0.382 Fib), $0.33, $0.36 (Sep ATH ), $0.42, and lastly $0.46. The biggest challenge will be the $0.33-0.36 range (Golden Pocket to Sep ATH ). Also, there may be an upper trendline, helping form a rising channel, but we ideally need another confirmation.
If BTC stays fairly bullish, ROSE may soon rally hard, as it tends to get strong bounces off the trendline. Best case, ROSE hits $0.42, but more realistically may set a local top at the Golden Pocket near $0.36, before retracing. The price action will be largely governed by how well BTC does. In the immediate short term, ROSE needs to break the $0.27 range, and if it fails here, may return to the trendline at about $0.245.
Conclusion is ROSE looks like a great buy right now, and I would highly recommend Dollar-Cost-Averaging the dips. BTC has fired many bottom signals, and is primed for a pump through to next year. It is realistic to see ROSE at $5-$10 by next year.


ROSEUSDTHello Crypto Lovers,
Mars Signals team wishes you high profits.
We are in the daily time frame. As you can see the price has been able to break its resistance line to the upside and this line has turned into a support line. After fluctuating above it, the price has made a come back to the line which can be considered as a pullback. The price can be supported here and move toward our target. We can also see an inverse head-and-shoulder pattern in the picture which can lead to the price increase. But if it goes below our support line and stabilize there, we will have more falling which is less likely.
Warning: This is just a suggestion and we do not guarantee profits. We advise you analyze the chart before opening any position.
Wish you luck

ROSEUSDTOasis Network (ROSE) is a privacy-focused layer 1 blockchain built for open finance and a responsible data economy using the Cosmos SDK. That will allow Oasis to interact with the ecosystem of the Cosmos (ATOM)-enabled blockchain when its Inter Blockchain Communication Protocol launches. Oasis prioritizes use cases that promote data privacy and user confidentiality and aims to power private, scalable DeFi and expand it beyond traders to the mass market. Oasis achieves high throughput and boasts a secure architecture by separating the contract settlement and consensus layers. This separation of layers allows the blockchain to support multiple, customizable runtimes (ParaTimes). It is similar in its architecture to the structure of Avalanche or Polkadot, connecting several different blockchains within one ecosystem.
Now that Oasis has gone live on mainnet, its roadmap for the future features the launch of an Ethereum Virtual Machine (EVM)-compatible ParaTime dedicated to DeFi, launching a decentralized exchange (DEX) and a lending protocol on ParaTime, and onboarding more DeFi apps to it.

ROSE/USDT-1D-BINANCEThis is not a financial advice. Always do your own research and always put stoploss in your trade (SL) :) If you want more detailed info
how to study and read charts or just need help with some coin, just write to me here a comment, i will try to answer to everybody...
i can help you :) all for free, don't worry, BE HAPPY!

RoseUSDT 16 Dec.ROSE
Hi, Wellcome
We can open a Nice order here, You just need to open the Trade At the Retest not just after the Breakout.
Because confirmation is necessary rather than losing money.
So just follow the mentioned
Open Order Price
TP Price
SL price
Note: please keep in mind that if any bad news happens regarding this Coin then you should need to work promptly.

I (still) ❤️ ROSE - post crash trading planROSE has seen a strong pullback with the rest of the market, but unlike many alts the overall marco bullish trend remains intact (for now), this trend is indicated by the heavy teal line on the chart. The trend was threatened yesterday but structurally we can see that it is likely the long term traders rather than trend traders who have been stepping in and using marco indicators to buy ROSE at a discount, as we see ROSE tapped a weekly doji open and saw a strong rebound from this level.
This rebound for me is a definite sign of health, though we a not out of the woods yet. For now I will be watching to see if ROSE can consolidate above the macro trend, revisit the new declining trend before finding further support to the low side for another move up. RSI is showing a nice historical rejection level, though it is not unlikely that we see a double bottom on the RSI before price reversal. Note also that daily MACD is now printing a nice hidden bullish divergence
On the downside, if the macro trend breaks I have marked out a zone of interest for me, which is confluent with a monthly doji, and so a monthly resistance area, and a weekly doji open again indicating a high value area, around 0.17. We also have the 0.19 resistance level above this which might also be a good point of rejection, so that makes this zone between 0.17-0.19 a key area for me to watch.
A word on BTC: Obviously BTC will dictate much of the market direction, but I am optimistic about BTC too, as much of the open interest has been flushed out of the market and data suggests that a huge accumulation has been taking place from small hands to big, it too can still revisit the low 40s but I am liking its current rejection above the 47k. As I said in my previous posts about BTC, a big wick into the 40s was not out of the question, we just have to be responsive to price action from here, make plans for all possible market directions and follow them. This move was a lot more aggressive than I anticipated but Market makers have flushed a lot of leveraged traders out of the market and this is not a bad thing for the market - I noted in my previous BTC trading plan I would be buying wicks into this zone and have been. I am still confident in the overall market direction, though there will likely be an opportunity to revisit the lows for both BTC and ROSE, so there is a need to be super diligent with risk management as there is still selling pressure and we should be following the LTF for confirmation of a shift back into a phase of bullish momentum.
I'm holding for now, and accumulating at zones of interest and will open larger swing trades when a market reversal seems apparent

Will Rose Bloom again? TF 15 RSI look fine. Rose went up and down for few days now and have a nice performance.

TRENDLINE ( BULLISH) BINANCE TOP GAINERtrendline broken reached support zone
buy here ... and bullish wave 30-50% possible in btc bear phase
Target $0.33-35-40-42
target are in chart.
use tight stoploss

ROSE\USDTIn resistance range 0.2400
You can shop.
And I've set the target above for you.
this currency is very good for volatility.

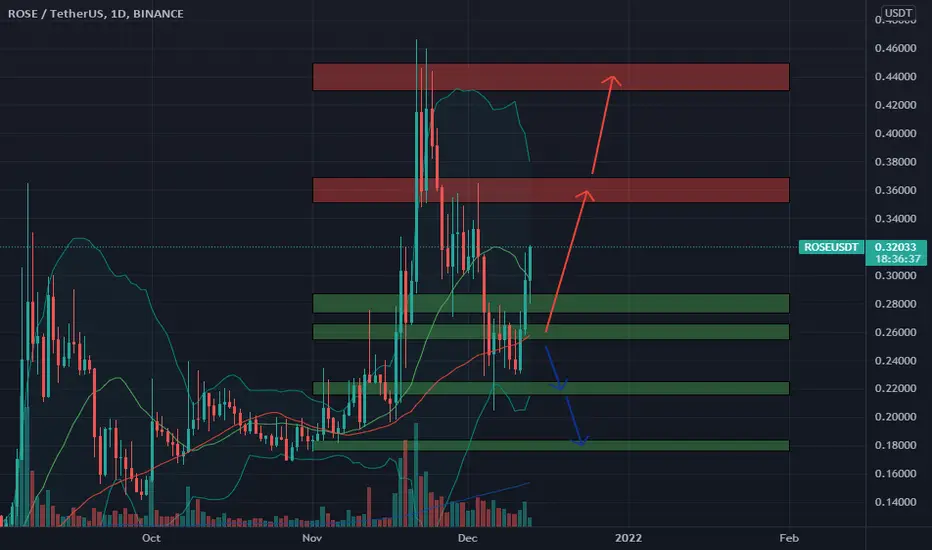
🆓Oasis Network (ROSE) Dec-13 #ROSE $ROSE
.
📈RED PLAN
♻️Condition : If 1-Day closes ABOVE 0.26$ zone
🔴Buy : 0.28 - 0.26
🔴Sell : 0.36 - 0.44
📈BLUE PLAN
♻️Condition : If 1-Day closes BELOW 0.26$ zone
🔵Sell : 0.26
🔵Buy : 0.22 - 0.18
❓Details
🚫Stoploss for Long : 10%
🚫Stoploss for Short : 5%
📈Red Arrow : Main Direction as RED PLAN
📉Blue Arrow : Back-Up Direction as BLUE PLAN
🟩Green zone : Support zone as BUY section
🟥Red zone : Resistance zone as SELL section
ROSE 3H BUYROSE 3H support is at ~$0.264
Enter 50% here
and try to set some buy orders near the support zone
If ROSE holds above the trendline,
the Take-Profit target would be $0.277, $0.29, and $0.37
Cheers

ROSE USDT entry point @ 3 days from Dec12thThis pair is trading in a descending triangle, but expect it to break this trend around Dec 15.
RSI is moving in the overbought zone.
Possible ENTRY Point at 0.22893
Conservative EXIT point at 0.3575 —> @ 52% profit
Optimistic EXIT point at 0.4100 —> @ 78% profit
Placing a Take Profit in the first exit point is always a good strategy. 20-50% of the position, depending on your capacity of handling risks.

ROSEUSDT and WTZ2 Trade SetupDuring corrective period of major cryptocurrency, we may find some alt. coin with buy signal in sub. timeframe. I apply WTZ2 (WT Cross) for trading ROSEUSDT in hourly chart. Before trading, let's calculate and manage your risk well. Good Luck.


ROSEUSDT - bullish and strength to go 60%++ in few daysRoseUSDT is looking strong, and the trendline breakout and retest is completed. RoseUSDT is looking good at these levels for good bounce upwards for 60%++. I will be posting more charts on ROSEUSDT soon.
Gann analysis on BTCUSDT and other top coins shows 14th Dec onwards as good rally and trend change for upward movement. People want good Christmas .. perhaps. Let's look at these levels.
Other top coins:
MDT, PRY, FIO, MATIC, NKN, SKL and more.
Follow me on trading view!

ROSE LongTop pick by the institutional investors but very fluctuated. PriFi has always been one of the top sector in the future imo.

Rose reverse head and shoulders?Looking like a reverse head and shoulders with a wide right shoulder. If it holds the blue rectangle then we should hopefully turn bullish.

rose usdt chartrose usdt chart
2 diffrent idea for rose
go long after break the resistant or short after red momentum candle
