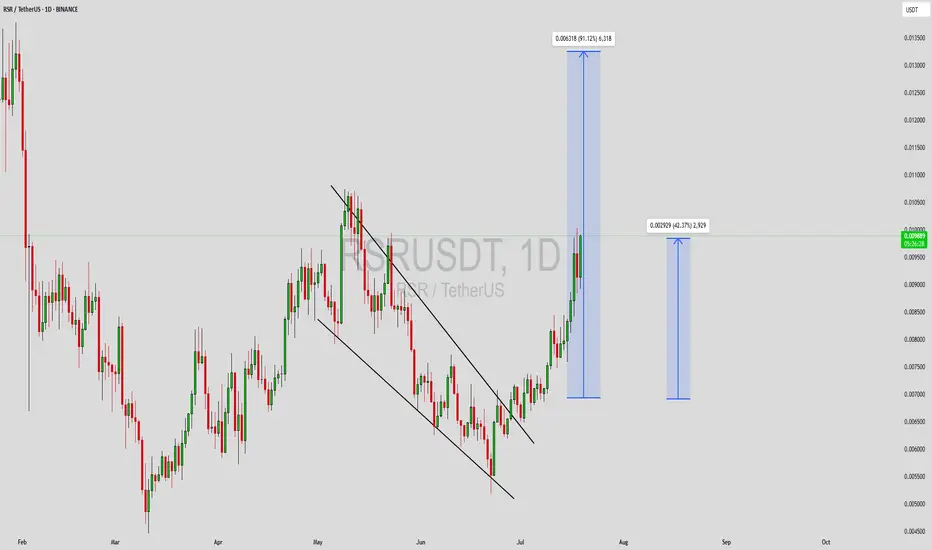
RSRUSDT Forming Bullish WaveRSRUSDT is exhibiting a clear bullish wave pattern on the daily chart, breaking out of its previous downtrend channel with strong momentum. This kind of technical setup often precedes a continuation rally, especially when paired with rising volume. The current breakout is supported by a steady incre
Related pairs
Reserve Rights · A Rising Trend · New ATH Potential in 2025I took my time drawing this chart for you showing all the different stages of the market cycle.
We are looking at Reserve Rights (RSRUSDT) on the weekly timeframe.
Full chart
» A bear market ends with an ending diagonal pattern and final bottom.
» The reversal forms as a classic cup and handle

RSR/USDT Breakout Play – Approaching a Major Reversal
🧠 Full Technical Analysis (Timeframe: Daily)
RSR/USDT is at a crucial decision point after months of consolidation.
The price action has been forming a classic Descending Triangle pattern, a structure that often precedes major breakouts or breakdowns. As we approach the apex of the triangle, RSR

RSRUSDT 1D#RSR has broken above the Descending Broadening Wedge resistance on the daily chart.
If a successful retest of the pattern and a breakout above the daily SMA50 occur, the targets are:
🎯 $0.008306
🎯 $0.009042
🎯 $0.010089
🎯 $0.011423
⚠️ As always, use a tight stop-loss and apply proper risk manageme

RSR/USDT📊 RSR/USDT Trade Outlook
🟩 Bullish Window:
We're entering a potential bullish range during this period, based on Gann time cycle analysis.
📅 Key Dates to Watch:
🔸 June 1
🔸 June 2
🔸 June 5
🔸 June 9
These dates are likely to act as turning points or triggers for momentum shifts.
🔍 What to Watch:

RSR 1H chartThis chart features RSR on a 1-hour timeframe with a 50-period SMA, RSI(14), and trend lines. Created for technical analysis and personal reference. Shared for transferring to another account.

RSRThings are looking really bullish for RSR.with a lot buy volume coming with being added to Coinbase this will be a sleeper.

RSR Bearish Head and Shoulders Pattern Confirmed🚨 SEED_DONKEYDAN_MARKET_CAP:RSR Bearish Head and Shoulders Pattern Confirmed 🚨
SEED_DONKEYDAN_MARKET_CAP:RSR has formed a bearish head and shoulders pattern and has already broken below the purple neckline. This indicates a potential for further downside movement. However, if the price breaks o

RSRI Think RSR will be a great performer this cycle,one of the few that's back at its back out area once we work out of here onward!

RSR possible playout in coming weeksRSR / USDT
It looks like it’s bottoming out
RSR is trying to breakout multi resistant levels on HTF
Lower trend line is acting as main support and must hold to keep its bullish sentiment
EYE ON IT

See all ideas
Summarizing what the indicators are suggesting.
Oscillators
Neutral
SellBuy
Strong sellStrong buy
Strong sellSellNeutralBuyStrong buy
Oscillators
Neutral
SellBuy
Strong sellStrong buy
Strong sellSellNeutralBuyStrong buy
Summary
Neutral
SellBuy
Strong sellStrong buy
Strong sellSellNeutralBuyStrong buy
Summary
Neutral
SellBuy
Strong sellStrong buy
Strong sellSellNeutralBuyStrong buy
Summary
Neutral
SellBuy
Strong sellStrong buy
Strong sellSellNeutralBuyStrong buy
Moving Averages
Neutral
SellBuy
Strong sellStrong buy
Strong sellSellNeutralBuyStrong buy
Moving Averages
Neutral
SellBuy
Strong sellStrong buy
Strong sellSellNeutralBuyStrong buy
Displays a symbol's price movements over previous years to identify recurring trends.
Frequently Asked Questions
The current price of RSR / TetherUS (RSR) is 0.007160 USDT — it has fallen −3.89% in the past 24 hours. Try placing this info into the context by checking out what coins are also gaining and losing at the moment and seeing RSR price chart.
RSR / TetherUS price has fallen by −14.90% over the last week, its month performance shows a 12.01% increase, and as for the last year, RSR / TetherUS has increased by 50.96%. See more dynamics on RSR price chart.
Keep track of coins' changes with our Crypto Coins Heatmap.
Keep track of coins' changes with our Crypto Coins Heatmap.
RSR / TetherUS (RSR) reached its highest price on Apr 16, 2021 — it amounted to 0.119000 USDT. Find more insights on the RSR price chart.
See the list of crypto gainers and choose what best fits your strategy.
See the list of crypto gainers and choose what best fits your strategy.
RSR / TetherUS (RSR) reached the lowest price of 0.001603 USDT on Aug 17, 2023. View more RSR / TetherUS dynamics on the price chart.
See the list of crypto losers to find unexpected opportunities.
See the list of crypto losers to find unexpected opportunities.
The safest choice when buying RSR is to go to a well-known crypto exchange. Some of the popular names are Binance, Coinbase, Kraken. But you'll have to find a reliable broker and create an account first. You can trade RSR right from TradingView charts — just choose a broker and connect to your account.
Crypto markets are famous for their volatility, so one should study all the available stats before adding crypto assets to their portfolio. Very often it's technical analysis that comes in handy. We prepared technical ratings for RSR / TetherUS (RSR): today its technical analysis shows the strong sell signal, and according to the 1 week rating RSR shows the sell signal. And you'd better dig deeper and study 1 month rating too — it's neutral. Find inspiration in RSR / TetherUS trading ideas and keep track of what's moving crypto markets with our crypto news feed.
RSR / TetherUS (RSR) is just as reliable as any other crypto asset — this corner of the world market is highly volatile. Today, for instance, RSR / TetherUS is estimated as 8.15% volatile. The only thing it means is that you must prepare and examine all available information before making a decision. And if you're not sure about RSR / TetherUS, you can find more inspiration in our curated watchlists.
You can discuss RSR / TetherUS (RSR) with other users in our public chats, Minds or in the comments to Ideas.