RSRUSDT trade ideas

break out of ascending trianglersr has finally break out and close above ascending triangle. i am moving my stop loss up.

RSRUSDT Signal (Simple setup with good RR)Hello traders,
Based on the chart,
it looks like a retest of the broken resistance, I want to try to open a long position.
Entry: market and lower
Targets: 0.005 and 0.0055
after first target reached move ur stop in breakeven!
SL: 0.0034
Risk/Reward: 1 to 3.5
Good luck!
Please, feel free to share your point of view, write it in the comments below, thanks!

Short MR RSRI would love to short it once it rejected from the 200 ema
however the entry here is decent too
dump to a new low
thanks

a claer bullish move for rsra claer bullish move for rsr as rsr are supporting daily and weekly support and also breaking trendline as well


RSR 125 % profit (NEW)RSR is at the buy zone. The support is strong and we expect it to hold.
RSR may pump even 125 % .
The final target would be a strong resistance and the wick from 7 of July 2022. Don´t forget to take profit on the way up.

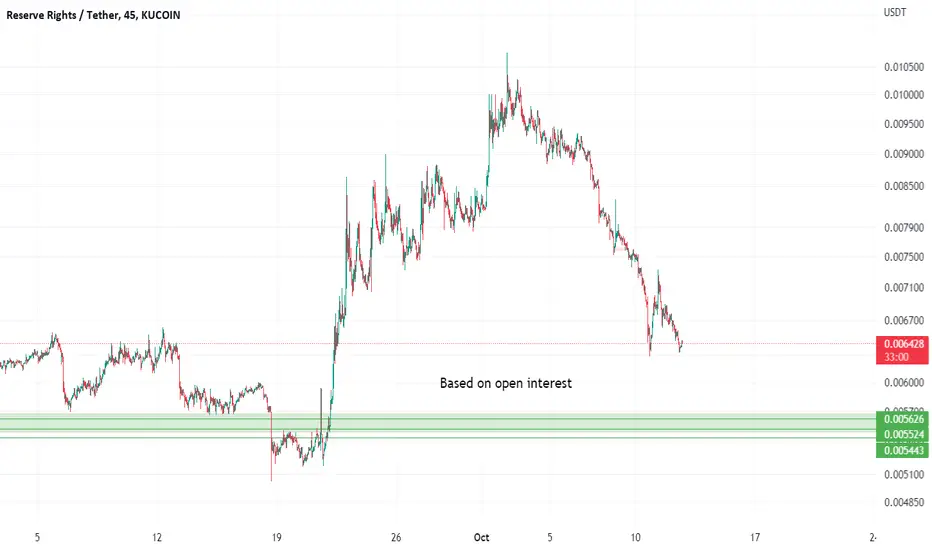
RSR 1DRSR has successfully failed previous support zone and went for the last support zone on 1W.
a) Would wait for about 10-14days, to see if it will hold the zone and accumulate
or
b) Correction continues to the hell with BTC.
IF (a) I would enter on local (4h) breakout, like the previously in MAY (10-22) from the 12 days of support.

Ichimoku Analysis for RSRprice closing below the cloud and also lagging coming below the cloud. We could see 0.0049.

ONLY SELL WITH 53/128 PAIRS DROP- 53/128 pairs drop with the volume higher than 4 times the moving average.
- Should to cancel all long position.
- Wait to a Short position continue.

Sellers are pushing. Interesting coinInstrument has formed long consolidation above strong support level. Volumes are higher than average. Waiting for the next touch and higher sellers volumes to catch impulse. Delta is stably red for 15 minutes in a row, showing increase of sellers pressure. Target - 0.0055

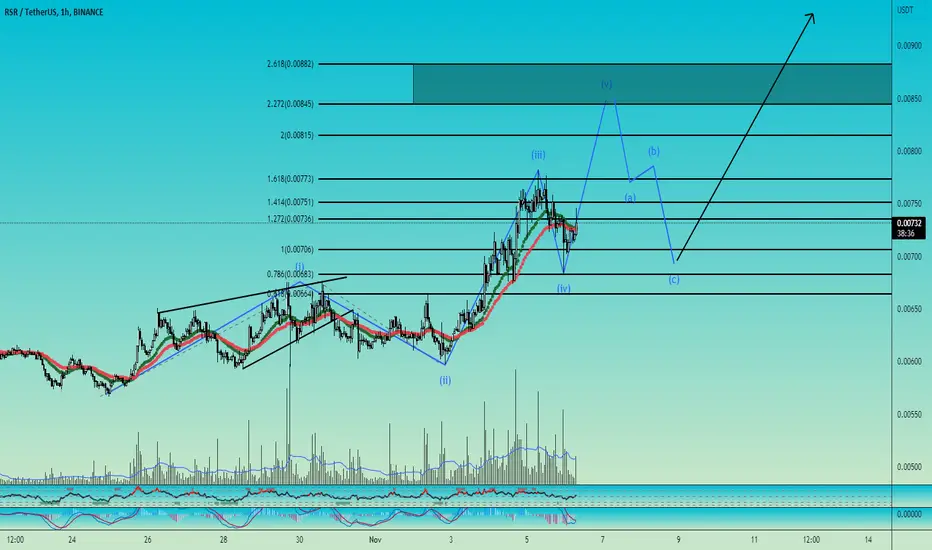
RSR/USDT Elliott Wave count 1H TFExpecting a 5th wave on RSR with target into the 0.0845 - 0.0882 zone and than we may have a correction.
1st wave a leading diagonal
2nd wave a WXY correction
3rd wave ended into the 1.618 fib extension W1 vs W2.
4th wave a zigzag correction.
RSR/USDT - LONG -- Support me with numbers and follow up on my account for other deals in the future. Thank you for coming to this part. --
-------------------------------------------------------
⚡️⚡️ RSR/USDT ⚡️⚡️
Exchange: Binance Futures
Trade Type: Breakout (Long)
Leverage: Cross (3.0X)
Entry Orders:
1) 0.006620 - 100.0%
Take-Profit Orders:
1) 0.006840 - 30.0%
2) 0.007150 - 30.0%
3) 0.007400 - 25.0%
4) 0.007720 - 10.0%
5) 0.008828 - 5.0%
Stop-loss Orders:
1) 0.006160 - 100.0%
Trailing Configuration:
Stop: Breakeven -
Trigger: Target (2)

SHORT RSRshort term trade - intraday
Entering with a break in the area, after that, you are waiting for a small correction, and entering directly with his secret. This is how you will be safe after that, taking profits, according to previous conditions that were resistances

$RSR - Saying it's my TIMEHello my Fellow TraderZ,
In the recent up move we saw many #DEFI tokens pumping out of nowhere an with a move of ~ 30-70%. Meanwhile $RSR was lagging behind or say consolidation near the Support Level.
On 4HTF, now #RSR seems to break the SYMMETRICAL TRIANGLE pattern + Horizontal level+ 200 EMA with a strong Volume.
I am waiting to load more on the retest and expecting a further 10-30% gains.
CHEERS!!!

RSR : WHALE SIGNAL FOR INCREASERSR has a high chance to get the whale pump trend since it's in a very interesting zone.
At the same time its breaks with our tool at a point where before were more pump trends on other coins.
Trade safe, as there is no guarantee in trading.
This update shows only the reason for our choice of RSR today.

RSR Long SetupHello, dear traders. how are you ? Today we have a setup to buy/long the RSR symbol.
For risk management, please don't forget stop loss and capital management
When we reach the first target, save some profit and then change the stop to entry
Comment if you have any questions
Thank You

RSR : THE 2 TARGETS WITH BREAKOUT VIEWRSR shows on a low time frame very interesting trends to increase.
It's also the NO 1 follow of the channel at this moment, to see the following coins check the channel homepage.
Most of the time if we expect an increase, then we add a follow on the channel like 📊 following RSR
# we check most of the time the coin at a low time frame because that can e the start for more.


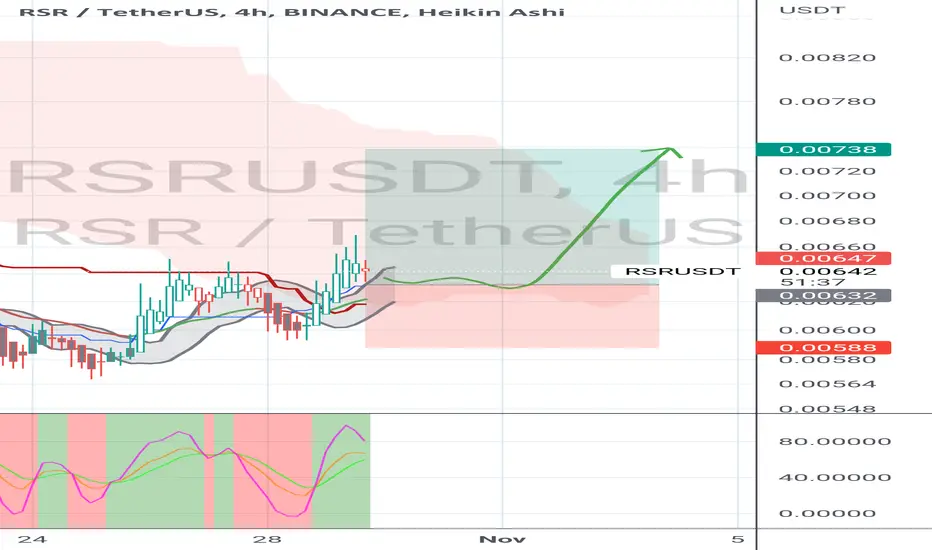
Trading opportunity for RSRUSDTBased on technical factors there is a Long position in :
📊 RSRUSDT
🔵 Long Now 0.00674
🧯 Stop loss 0.00610
🏹 Target 1 0.00735
🏹 Target 2 0.00815
🏹 Target 3 0.00960
💸RISK : 1%
We hope it is profitable for you ❤️
Please support our activity with your likes👍 and comments📝

RSRUSDTPrice is creating a bearish Cypher pattern, we can take a low-risk buy to point D; after that is completed, we will look for shorts.