Rsr usdt Short Position Rsr in Downtrend
Everyone Can Research On it Than Create Short
Otherwise Create Short Position Your own Risk
RSRUSDT trade ideas

RSR/USDT 1100% possible long trade setup 👀Welcome to RSR/USDT 12hour quick analysis
I have tried my best to bring the best possible outcome in this chart.
Reason of trade:-Hellow Members, Welcome to RSR/USDT quick update,
RSR/USDT currently trading inside the triangle pattern and on the support zone.
There is a high chance to bounce from this strong support zone all the way to 1100%.
You can take entry here on the support zone with a low average of 2x to 5x.
If it breaks down the support zone then close your position or use stop loss for safe trading.
Entry:-$0.011097,$0.017066
Target:-1100%
Stoploss:-$0.009470
With leverage 2x to 5x
And long term hold and good profit 😉🙂😊✈️✈️
Q:-What do you think about this?
Do you think we will see a new ATH of RSR in the next quarter?
Share your views in the comment section.
Remember:-This is not a piece of financial advice. All investment made by me is under my own risk and I am held responsible for my own profit and losses. So, do your own research before investing in this trade.
Happy trading.
Sorry for my English it is not my native language.
Do hit the like button if you like it and share your charts in the comments section.
Thank you.

RSRUSDT is creating a bear flagThe price got rejections from the dynamic daily resistance of the descending channel. on the daily timeframe, the price had a false breakout from the 0.13$ and got a rejection from the 4h structure.
On the 4h Timeframe, the price created a bear flag and after the breakout, the market retested the previous support as new resistance.
Now the price is creating a minor bullflag.
How to approach?
We are monitoring the price, if the price is going to lose the 0.11 and confirm the breakout, the next valid support is the daily one on 0.997$
According to Plancton's strategy , we can set a nice order
–––––
Keep in mind.
🟣 Purple structure -> Monthly structure.
🔴 Red structure -> Weekly structure.
🔵 Blue structure -> Daily structure.
🟡 Yellow structure -> 4h structure.
–––––
Follow the Shrimp 🦐

#RSR/USDT 15M UPDATE BY CRYPTOSANDERSWelcome to this quick RSR/USDT analysis.
I have tried my best to bring the best possible outcome in this chart.
Reason of trade:- RSR/USDT looks good bullish pattern
Entry:- CMP
Traget:-15% TO 20%
Stoploss:- $0.1265
Remember:-This is not a piece of financial advice. All investment made by me is under my own risk and I am held responsible for my own profit and losses. So, do your own research before investing in this trade.
Happy trading.
Sorry for my English it is not my native language.
Do hit the like button if you like it and share your charts in the comments section.
Thank you...

RSRUSDT - Long - Potential 26.25%RSRUSDT - Long - Potential 26.25%
Exchanges: Huobi.pro, Binance, KuCoin, Bittrex
Signal Type: Regular (Long)
Entry Targets:
1) 0.01205
Take-Profit Targets:
1) 0.01266
2) 0.01353
3) 0.01496
Stop Targets:
1) 0.01099
Entry Trigger - Bullish divergence, exhaustion candle, bullish weekly pivot
Trailing Configuration:
Entry: Percentage (0.0%)
Take-Profit: Percentage (1.0%)
Stop: Breakeven -
Trigger: Target (1)

an easy 90% profit on RSRas you can see , there is an easy 90% profit in RSR on the weekly candles
NB: don't buy before the confirmation with higher high and higher low in the daily and 4h candles after this period

RSRUSDT PRICE PREDICTION- RSR almost wiped out all the gain from 2020-2021.
- If Bitcoin make a ATH we will see RSR pumped aggressively.
- 0.5$ maybe on the table. Make its market cap reach 50billion dollars.

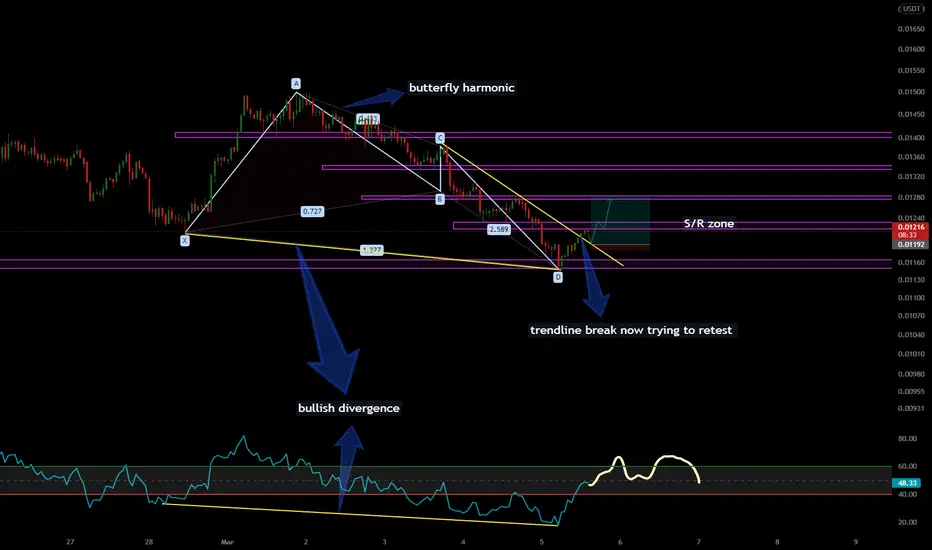
RSR/USDT - Technical Analysisi am bullish on rsr/usdt
because of
butterfly harmonic find
trendline breakout and trying to retest
bullish divergence
RSR USDT I think RSR is ready to fly if you do not trust me just put 10$ then check it after couple months :)
just need some time

RSRUSDTI share my opinion in order to get an opinion about my technical analysis if anyone has suggestions for improvement I would love to have them

RR=2.7 buy ideaBullish crab pattern + five elliot impulsive wave count + RSI at oversold zone , we might be at the beginning of first corrective wave leg formation *
PS : never risk more than 2% of your capital per trade

RSRUSDT is testing the weekly supportThe price got rejections from the dynamic daily resistance as you can see on the upper chart. The price lost the weekly support around 0.022$ and retest it as new resistance.
At the moment the price is testing the previous weekly support on the 0.16$ and lost the 4h support and the price retested as new resistance.
How to approach?
For a long scenario, we need to see a breakout of the 4h resistance and daily resistance. We could see a spike in the weekly support around 0.015$. If the price will get liquidity and the market will shift from bear to the bull, According to Plancton's strategy , we can set a nice order
–––––
Keep in mind.
🟣 Purple structure -> Monthly structure.
🔴 Red structure -> Weekly structure.
🔵 Blue structure -> Daily structure.
🟡 Yellow structure -> 4h structure.
–––––
Follow the Shrimp 🦐

RSRUSDTTwo signs that the price is going up 1. Divergence 2. The head and shoulders pattern is already complete. Goodluck

rsr:bearishwe think RSR token seems more bearish than bullish and we expect more correction in next month
tg 1: 0.0128
tg 2: 0.0095

RSR Bullish butterfly 🦋 Pattern in playRsr forming Bullish butterfly pattern on 1D time frame !
Fundamentally rsr is a strong project but same like many other alt coins its not performing very well ( Btc.D) sucking liquidity from alts ! but on the bigger picture rsr will play out bullish !
ps:- this is just my observation so its not a Financial advice !

RSRUSDT - Channel Breakout !!RSRUSDT (4h Chart) Technical analysis
RSRUSDT (4h Chart) Currently trading at $0.020
Buy level: Above $0.0195
Stop loss: Below $0.0166
TP1:$0.022
TP2: $0.025
TP3: $0.0275
TP4 : $0.030
Max Leverage 3x
Always keep Stop loss
Follow Our Tradingview Account for More Technical Analysis Updates, | Like, Share and Comment Your thoughts.

RSR About fo flyAt the moment is breaking a major trends. as cryptos in general.lol.
target at 29 looks very reasonable

RSR WYCKOFF ACCUMULATION Looks like a clear wyckoff accumulation. Price is also only one cent away from all time low after major run up.


Same pattern as summer of 2021?Noticed a similar pattern in the summer of 2021 with the same high and possibly low.
Just a dubious speculation. :)
Not a financial advise.


RSR Ready to FlyRSR is in between the .786 and .886 reverse fibs. I like to use these fib levels as S/R. If it holds these levels it shouldn't have any problem going to .07 cents. MTF Stoch RSI on daily looks very bullish. Just waiting on the 4hr to reset and I will be looking for an entry.
