RSRUSDT.PRSRUSDT.P just entring into the bullish trend.
Bullish divergence also shown in RSI.
We wait for more confirmation.
we wait and watch for the breakout of last HH.
RSRUSDT trade ideas

RSR/USDT Bullish Breakout: Weekly Downtrend Line Surpassed and R
The major trend for RSR/USDT is currently upward. RSR recently broke above the weekly downtrend line, signaling a potential shift. It is now retesting the support line, which could provide an opportunity to continue the upward trend.

#RSR/USDT is trying to break the Diagonal Trendline in 1-hour TF#RSR/USDT is trying to break the Diagonal Trendline in 1-hour TF!
SEED_DONKEYDAN_MARKET_CAP:RSR needs to clear the trendline to turn bullish. The local resistance level is PMH $0.005988, and the support level is PDL $0.005258.

RSR/USDT: BREAKOUT,RETEST DONE! READY FOR AN ATH!!Hey everyone!
If you're enjoying this analysis, a thumbs up and follow would be greatly appreciated!
RSR looks promising here. It breaks out from the falling wedge-like structure in the daily time frame and a perfect retest is also done. Now, it seems ready for a 100-150% move. Buy some here and add more in the dip.
Targets:- $0.0068/$0.0092/$0.0122/$0.014
SL:- $0.0048
What are your thoughts on RSR's current price action? Do you see a bullish pattern? Share your analysis in the comments below!

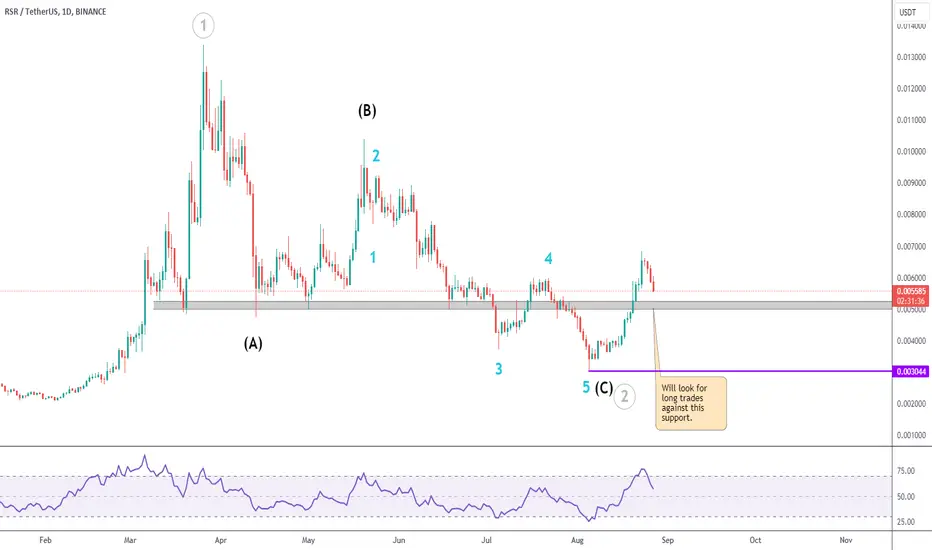
RSR Upside PrevailsI'm considering waves blue 5 / black C / gray 2 were finished at 0.003044 low.
The only caveat is that there is no RSI divergence at that level. Although it is preferred, it is not mandatory, and I'll stick with a bullish view for now.
The gray resistance was broken, and it's now support. This is a good level to look for long trades.
RSRSorry guys, I had to place an order and then it ran before I could post.
You can get back in on a retest of the trend line.
GLHF!

#RSRUSDT breakout The recent breakout of #RSRUSDT above the descending resistance, now turned support at $0.006050, this is setting the stage for a potentially explosive move.
#NFA
#DYOR

RSRUSDT Is This the Start of a Bullish Reversal?Yello, Paradisers! Are we about to witness a game-changing move in #RSRUSDT? Let’s dive in.
💎#RSR has flashed a bullish signal with a successful breakout above the "Lower High" (LH), indicating a shift in momentum from bearish to bullish. The trend change is confirmed, with the potential for price to first retest the support at $0.00598 before continuing its upward trajectory toward a new "Higher High" (HH).
💎We could also see a test of the demand zone, which would provide a solid foundation for a "Higher Low" (HL) and a significant rebound toward our target at the strong resistance area.
💎If the price fails to rebound at the demand zone around $0.005 and instead moves sideways with low volume, it’s a bad sign. This scenario increases the probability of a breakdown below the demand zone, which would invalidate the bullish momentum and suggest further downside potential.
Stay focused, patient, and disciplined.
MyCryptoParadise
iFeel the success🌴


RSR superOur buy and sell setup was super. Though we received a late buy print and it was obvious that trend has been exhausted. We see more downtrend if the price is below that EMA lines. Anything above EMA lines will be trend reversal. DYOR

RSRUSDT 1D#RSR is moving inside a falling wedge and has recently been rejected at the daily MA50. We may see a retest of the support level before a bounce. In case of a breakout above the pattern, we expect a 100% bullish wave.

RSRUSDT Buy opportunityRsrusdt has recently experienced a significant breakout from a falling wedge pattern. This breakout suggests a strong bullish sentiment and presenting potential trading opportunities.
We have identified a strategic buy back area on the chart, which presents an optimal opportunity for re-accumulation of the coin.
Targets for profit-taking have been outlined on the chart, ranging from immediate to final setup targets. These levels serve as potential exit points.
In the event of a price retracement, a robust demand zone has been identified to act as a strong support level, potentially preventing significant downside movement.
It is essential for us to exercise caution and implement effective risk management strategies. This includes setting moderate stop-loss levels to mitigate potential losses and adhering to sound money management principles.
Your insights and opinions on this coin are welcomed for further discussion.

RSR 30x move aheadRSR
we already bought the bottom(0.0022) & sold at top around 6x(0.013)
x.com
it's time to think for long term
SEED_DONKEYDAN_MARKET_CAP:RSR is close to its horizontal support that's makes big I H&S which completes around(0.095) that is 30x from green zone
set your bids
#NFA
#DYOR
follow for more updates

RSRUSDT bouncing from monthly supportThe price shot up beyond monthly resistance MR1 only to come back down and retest it again where it was rejected and sent back down towards monthly resistance MS1. The price has bounced from MS1 after hitting it and weekly resistance is causing the price to pullback on this bounce. The price might still dip into MS1 before a stronger bounce in case this current pullback goes further deep. However, this monthly support is a strong one and will allow the price to bounce and continue its journey in upward direction, Therefore, I see the price moving beyond monthly resistance MR1 after having a brief pause and pullback there. Once it breaks MR1, it will target monthly resistance MR2 zone. Therefore, a long from MS1 is favorable for this asset at least for the coming months.


RSRUSDTWe can attempt to short RSRUSDT from specified level as it making LH , also 0.5 FIB intact , also there is no bullish divergence occur indicate that it moves downward.
SL , TP mention in chart.

$RSR :: Everything is indicated in the diagramReserve Rights (RSR) is an ERC-20 token that will serve two main purposes for the Reserve Protocol: overcollateralization of Reserve stablecoins (RTokens) through staking and governing them through proposing & voting on changes to their configuration.
The Reserve Rights (RSR) token was launched in May 2019 following a successful initial exchange offering (IEO) on the Huobi Prime platform.

RSR buy setupThe structure of RSR is bearish, but we have a good demand at the bottom, which can be used to look for buy/long positions in the form of scalpy.
Liquidity pools are expected to be swept
Closing a daily candle below the invalidation level will violate the analysis
Note that the financial market is risky, so:
Do not enter any position without confirmation and trigger.
Do not enter a position without setting a stop.
Do not enter a position without capital management.
When we reach the first TP, save some profit and try to move the stop continuously in the direction of your profit.
If you have any comments please post them, comments will help us improve our performance
Thanks

$rsr HTF bottom | big volumethere are very few charts out there that look as clean as RSR does on the weekly. huge volume cluster at the lows. 30x back to the highs and this could easily run much higher.
ATH market cap was just over $5B.. $180MM market cap currently. Think at peak bull this could run to $+50B.

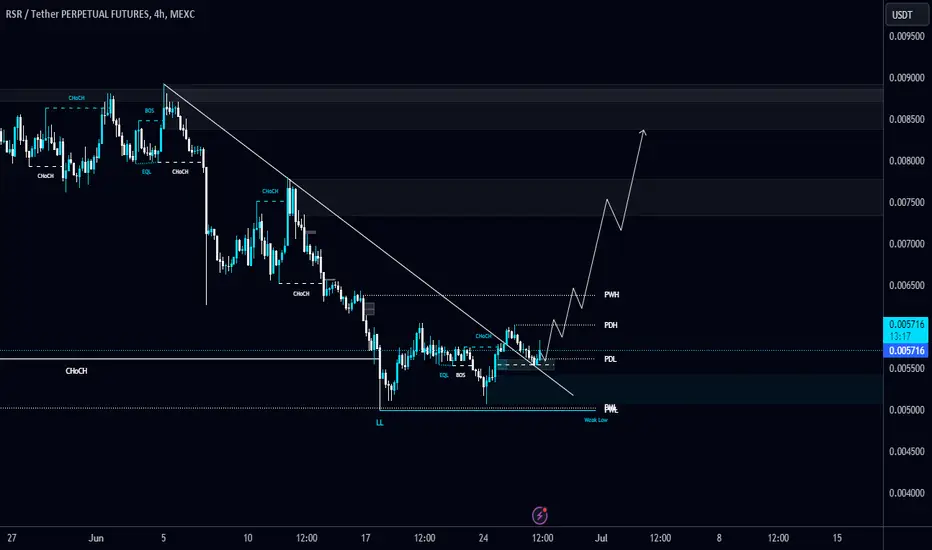
#RSR/USDT breaks the Diagonal Trendline in 4-Hour TF!#RSR/USDT breaks the Diagonal Trendline in 4-Hour TF!
SEED_DONKEYDAN_MARKET_CAP:RSR filled the 4H FVG too. Expecting a bullish momentum here. The local resistance level is PWH $0.0064, and the support level is PML $0.005.

RSRUSDT.4HThe RSR/USDT 4-hour chart reveals a recent uptick after testing the S1 support level at $0.004704. This movement could indicate the beginning of a bullish reversal within the lower trading range established in recent weeks.
The MACD shows a slight bullish crossover, where the MACD line has crossed above the signal line, signaling increased buying momentum. However, the overall MACD trend remains in the negative zone, suggesting the need for caution as the market might still be prone to bearish pressures.
The Relative Strength Index (RSI) is hovering around 45, which is closer to the middle range. This indicates a somewhat neutral market sentiment, not particularly leaning towards overbought or oversold conditions, which provides a balanced view but suggests monitoring for a clearer direction.
Given these conditions, if the price can sustain above S1 and continue to move higher, the next target could be the R1 resistance level at $0.005624. Traders should look for a consolidation above this level to consider a more definitive bullish trend towards R2 at $0.007841. Conversely, a fall below S1 might lead to testing the lower support S2 at $0.004070, which could validate further bearish sentiment. The key in the upcoming sessions will be the price's ability to hold above S1, signaling possible strength for a continued recovery.
