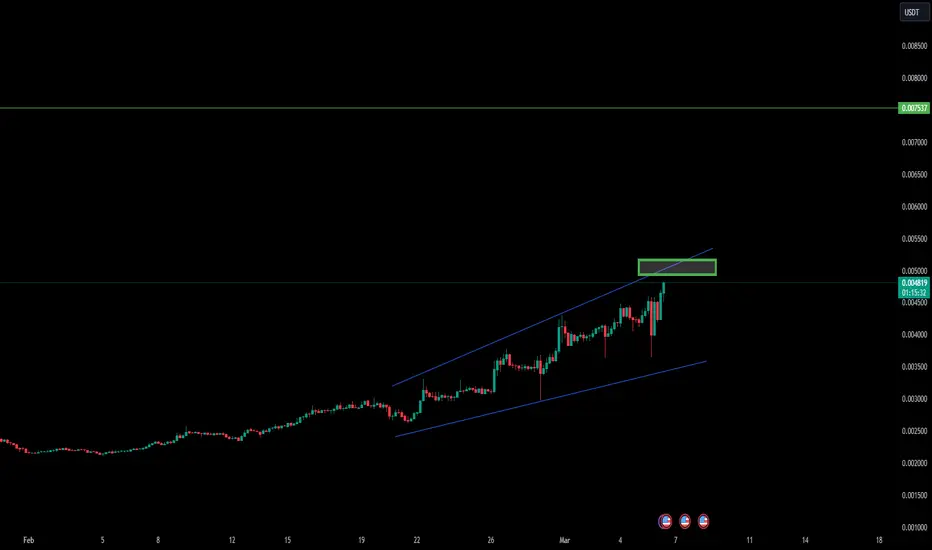
RSR NEW VOLUME INCREASERSR seems on a low time frame to enter a new volume increase which could enter a new break in the coming time frames.
We will follow up to see if it can have new confirmations.
RSRUSDT trade ideas
RSR/USDT Break out descending channel, Bullish Momentum for RSR?💎 RSR has recently experienced significant market dynamics. After breaking out of a descending channel, the price is currently undergoing a retesting phase before probability continuing its upward movement towards our target Bearish OB area.
💎 However, if RSR fails to bounce during this retesting phase and breaks below the support area, it could indicate a reversal in momentum, leading the price back downward towards the Bullish OB area.
💎 Historically, the Bullish OB area has acted as a strong support zone, with the price bouncing after reaching this level. Yet, if the Bullish OB area is breached, it may signal further downward movement towards the strong support area.

RSR Bounce?RSR Weekly bearish breaker algotarget, bounce level, expecting a price movement to at least 50% of that WBB-
RSI also ready for breakout, momentum shift
NFA

RSR/USDT gearing up for bullish ride? 👀 🚀 RSR Analysis💎 Paradisers, direct your gaze towards #RSRUSDT, which is currently showcasing signs of bullish potential from its demand zone.
💎 #Reserverights has recently hit a snag at the resistance level of $0.003309, prompting a pullback. Yet, should it manage to hold above the key demand level of $0.002832, we stand on the cusp of a bullish ascent aiming for the next critical supply zone at $0.003827.
💎 In the fast-paced realm of cryptocurrency, adopting a dynamic and adaptable strategy is paramount. Should #RSR struggle to secure its position at this vital demand level, pivoting to an alternate plan might become imperative.
💎 In this event, our contingency involves eyeing a bullish push from a more conservative support level at $0.002514. Keeping a vigilant watch on this threshold is essential, as breaking below it could herald a shift towards a bearish narrative for #RSR.

RSRUSDT.PRSRUSDT.P is in bullish trend.
Bearish divergence also shown in RSI>
Rising wedge reversal pattern also form .
We wait for the further confirmation if it breaks the last HL and made first LL>

$RSR Wyckoff Schematic - Full ReturnTo validate, youd want to see a reclaim of 0.004 and a checkback to confirm the break into the range is now being supported. Then youll typically get the sign of strength in short order, an impulsive move to 0.009 before you could expect a high and tight consolidation for the partial decline move / bu
This could present itself as a checkback at the prior supply zone or support. The partial decline would confirm with a retest of the range high, with the expectation thereafter of a breakout of the range and expansion phase into fib extension levels.
The liquidity dots are meant to represent path of travel when a level is reclaimed, or lost, and id consider each level a partial take profit opportunity, or zone you may expect to see consolidation / checkback after breaking out.
Dont let the operator fool you, he'll often over shoot these levels and then mean revert as a way of trapping traders in both directions.
The parabolic log curve is meant to act as a representation of time / mean reversion, alongside the initial trend. While an accelerating asset will steepen its trend, its often a good gauge of fair market value, and potential targets on corrective phases.

RSR will fly hardPrepare yourselfand DYOR
It' a TA not a financial advice
all are shown on the chart

$RSR #ReserveRights Trading IdeaRSR ReserveRights Token has the potential to increase in price. The candle has to close above this resistance (selling pressure) trendline.

on verge of massive breakout with 300% profit potential seems like it has already bottomed out and finally preparing for solid breakout
formed falling wedge and breaking out too incase of successful breakout expecting solid recovery
successful breakout can lead 300% bullish wave in midterm

RSRUSDT 1DKeep an eye on #RSR. It has almost complete the Cup & Handle formation. Wait for the breakout and then enter. Support is around $0.002614
Targets are on the chart.

RSR ANALYSIS🔮 #RSR Analysis 💰💰
🌟🚀 There is a complete formation of Cup and Handle Pattern in #RSR. We are just waiting for a perfect breakout. If #RSR breakout with good volume then we will see a very good bullish move.🚀🚀
🔖 Current Price: $0.002839
⏳ Target Price: $0.004783
⁉️ What to do?
- We have marked some crucial levels in the chart. We can trade according to the chart and make some profits in #RSR. 🚀💸
🏷Remember, the crypto market is dynamic in nature and changes rapidly, so always use stop loss and take proper knowledge before investments.
#RSR #Cryptocurrency #DYOR

Accumulation before the level, free zone after the levelAccumulation before the level, free zone after the level

RSR LOOKS BULLISHFrom where we entered "Start" on the chart, it looks like we had a counter triangle, but now the upper side of the triangle is broken.
We have a flip range on the chart, which we have marked with green color. From this area we can move upwards. We have included the targets on the chart. We also specified the invalidation level on the chart. Closing a daily candle below this level will violate this analysis.
For risk management, please don't forget stop loss and capital management
When we reach the first target, save some profit and then change the stop to entry
Comment if you have any questions
Thank You

RSR/USDT: Flag pattern breakoutAs we can see in the chart, RSR had a clear breakout after forming the flag pattern. This is a clear sign of bullish moment. As the overall market is currently bullish is another plus point for the RSR bullish moment. We can expect this bullish moment to continue and reach our LONG trade targets.
We are planning to enter trade at 0.003022 - to 0.002982 with our eye on the first target around the resistance range of 0.003129
Entry Price: 0.003022 - to 0.002982
Stoploss: 0.002875
TP1: 0.003129
TP2: 0.003222
TP3: 0.003374
TP4: 0.003595
Don't forget to keep the stoploss.
Like and follow us for more ideas.
Cheers
GreenCrypto

RSR LONG hello Traders, here is the full analysis for this pair, let me know in the comment section below if you have any questions, the entry will be taken only if all rules of the strategies will be satisfied. I suggest you keep this pair on your watchlist and see if the rules of your strategy are satisfied. Please also refer to the Important Risk Notice linked below.


RSR ready for PUMPRSR retested BO, which was a resistance, months later. If BTC stays strong, it may start to rise again


RSRUSDT1H
according the strategy, pending order inside OB is acceptable with Entry price, SL and tp drawn on the chart


RSR/USDT Struggle Breakout the Key resistance area💎 RSR has become a focal point in the market, facing challenges in overcoming a key resistance area. Recently, RSR experienced a setback after being repelled at this critical level. Should RSR manage to break through this resistance, there's a strong likelihood of a significant upward trend, the probability with our next milestone being the Bearish OB target.
💎 However, if RSR is unable to achieve a breakout and instead remains in consolidation at this resistance level over the next few days, it might face another rejection. This could lead RSR to revert back towards the demand area.
💎 At the demand level, a strong response from RSR is essential. If it fails to demonstrate a rebound from this zone, there's a risk of breaking down further. Such a scenario could signal a shift back to a bearish trend for RSR, potentially leading to a descent towards a stronger support area.

$RSR bullishIf we are in the beginning of a new bullrun for crypto I think this might happen during 2024,2025 or part of 2026
