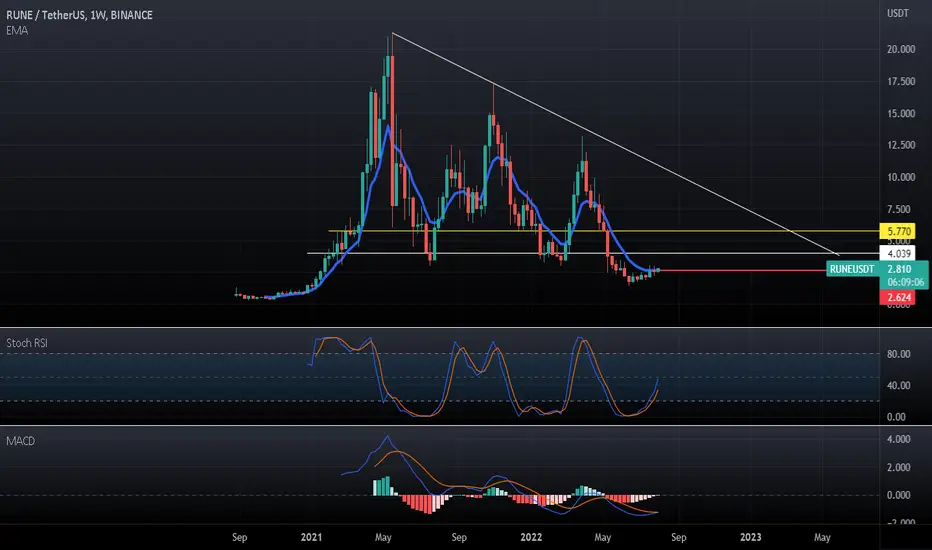
RUNEUSD ❕ broke down the liquidity zoneRUNE broke the upward structure.
The asset broke down the uptrend line and the liquidity zone.
The coin has already tested the current resistance level, but there are risks to test it again. I expect that after fixing under resistance, RUNE will continue to decline.
RUNEUSDT.P trade ideas

RUNE/USDT - Hourly Bullish Divergence Few days ago, I have indicated a bearish divergence on daily frame for ETH /USDT and BTC USDT. True enough it got dumped.
Today after the dump, a bullish divergence is appearing with RUNE and there will be a short pullback up.
BE WARNED. Overall trend is still bearish.
If you wanna get some fast money, go long for now until it reaches the resistance.
Watch this space, like and follow if you wish to continue to receive updates.
I use mostly divergence as it can predict next move.
Check my previous ideas to see how divergence worked to perfection :)

RUNEUSDT sk analysiswe will keep waiting till the market reached our intercepted zone (orange and red) RR:3:1 after finishing the orange bears sequence which will give us good potential for the market to go up

Buy Rune/USDTHello, Rune/Usdt is hovering Near Trend Line Support.You Can buy it And Make Profit. Also it is Fundamentally Good Coin 😇

RUNE Support & Resistance>>>>>>>>>>Hello EveryOne
I Have Tried My Best to Bring the best Possible outcome in this Chart.
Based on the convergence of the RUNE by BTC price,
market does not correct in the next,
I expect, maybe short correct in ahead of RUNE to marked blue support's area.
In case of support and break's marked resistance area (supply zone) on the chart,
We can setup long position to next level,
Plz step by step save the profit and reset SL.
Short term support & resistance's marked on the chart.
This is not financial advise.
PLZ DYOR
With hopping success>>>>>

RUNE/USDT: On his way for bullish reversal---- Mid-term Analysis for the next coming 4 weeks to 3 months - Daily on Daily Chart (LIN)-------
RUNE/USDT: On his way for bullish reversal
Context
- The Global Crypto market leads by BTC and ETH reversed a new bullish trend - RUNE for now is still lagging versus ETH
- We are watching at 3,25/3,77 area to bypassed to extend the bullish recovery in progress
- Watch 2.00 as key support
Previous analysis : 18/08/2022 :
Market configuration
- Graphical Elements :
Graphical Resistance = 3,25/3,77 & 8,35 & 13,50
Graphical Support = 2,00
- Mathematical Indicators:
EMA ( Exp Moving averages) are now support at 2,69 = Bullish / Neutral
RSI indicator (below) is now above 50% area = Bullish
- Elliot & Harmonic Wave (Fibonacci):
Fibonacci Target E (B) has been already reached = 1, 42
Fibonacci resistance of the wave in progress = 3,25/3,77
Fibonacci support of the wave E (B)(max extension) = 1,42
Fibonacci Bullish Target = 5,48 & 6,25 (auto-similar move)
Conclusion
Preferred case => AS long as 2,00 remain support, we are looking at buy the dips in the buying area in order to challenged 3,25/3,77 and surpass this zone to confirm a bullish reversal towards 5,48 in a first step

RUNE/USDT: about to triggered significant recovery---- Mid-term Analysis for the next coming 4 weeks to 3 months - Daily on Daily Chart (LIN)-------
RUNE/USDT: about to triggered significant recovery
Context
The Global Crypto market leads by BTC and ETH is still evolving within a bearish market configuration. Like the others digital assets RUNE has been suffering about negative global market situation which should be ended with the rrecent bounce on going on ETH surpassing 1440
Previous analysis : 08/06/2022 :
Market configuration
- Graphical Elements :
Graphical Resistance = 3,25 & 8,35 & 13,50
Graphical Support = 1,62
- Mathematical Indicators:
EMA ( Exp Moving averages) are capping the market at 3,25 = Bearish / Neutral
RSI indicator (below) is bouncing off key support and challenge 50% area = Bullish
- Elliot & Harmonic Wave (Fibonacci):
Fibonacci Target E (B) has been already reached = 1,60/1,40
Fibonacci resistance of the wave in progress = 3,25
Fibonacci support of the wave E (B)(max extension) = 1,09
Fibonacci Bullish Target = 8,35 & 6,25 (auto-similar move)
Conclusion
Preferred case => Regarding the mid-term element, RUNE is still offering a good opportunity to play a continuation of the recovery on going - we adjust the key support 1,62, bypassing 3,25 the bullish recovery will be defenitly confirm offering opportunity to add the exposure on this Token

RUNEusdtin 4h Time Frame, RUNE is in a bullish channel
in 1h Time Frame, above 2.915 is appropriate for Long position
in 1h Time Frame, bellow 2.852 is appropriate for Short position

RUNE/usdt in 1HRUNE has arrived to upward trendline and support line junction , in 1H time frame
that would in my opinion , if RUNE break 2.8$ support area to the downside , The downward trend will begin.

rune broke out we need a retest now.Hey traders seems like the coin has broke out if the retest holds that would be amazing 90% move up

OP.Usd (Y22.P3.Video1).Cup and Handle QuestionHi All,
My thoughts for now, giving you reasons why it aligns with the cup and handle scenario.
I talk about the bullish targets, and also the bearish scenario.
Please give me a like and share,
All the best,
S.SAri

RUNE/USDTRUNE/USDT
formed an incremental triangle.
If it breaks the resistance of $3.1, it can climb up to $6.
#RUNE #RUNEUSDT #BTC #BTCUSD #LUNA #LUNC #UST

Rune/USDT Long📈Previous important support and resistance zones:
***s1: 2.618
**s2: 2.561
***r1: 3.034
**r2: 2.791
Conditions for Long:
1. Bull flag breakout
2.trendline breakout
3.momentum indicator trendline breakout
4.support from previous resistance ***r1 zone
6.Money flow index turned green from red
7.volatility has increased
8.di+ is above the di-
9.adx line is above the 20 level
Stoploss:
1.below the previous resistance zones of ***r1: 3.034
Take profit:
1.take profit is dynamic,trailing stop loss/take profit
Exit point:
1.will be updated later in the comments box only if someone asks

RUNE after CPI - Hidden Bearish DivDeclining RSI + Increasing Price = Hidden Bearish Divergence
Good to short now.
Be warned!

#RUNE/USDT - Long - Potential 31.32%CPI report causing a pump in all risk asset markets. Trading View is struggling with the pump so unfortunately I cant show you my set up but it is written out in the text below. RUNE on a pullback with support below.
#RUNE/USDT - Long - Potential 31.32%
Exchanges: Binance, KuCoin
Signal Type: Regular (Long)
Entry Targets:
1) 2.809 - 100.0%
Take-Profit Targets:
1) 2.973 - 33.333%
2) 3.367 - 33.333%
3) 3.696 - 33.333%
Stop Targets:
1) 2.421 - 100.0%
Trailing Configuration:
Entry: Percentage (0.0%)
Take-Profit: Percentage (1.0%)
Stop: Breakeven -
Trigger: Target (1)

RUNEUSDTwe almost there with RUNEUSDT i believe we will see and entry today after the news, don't just jump in be patient and wait all your boxes to be ticked before u enter.
do your own research, trade safe and at your own risks

RUNEUSDT |Glorious review| Wanted an altraket? Hold on!Hello everyone, I wrote a new idea for you. I think it's easy to like and subscribe to the channel, thanks😉
📌 Friends, I want to share with you technical analysis on #Run, I think there are options to break through the first target of $3.040
📌It will be safer to open a deal from the borders of the trend line, my entry will be from the trend line!
Write comments and like what do you think about this?👇

RUNEUSDT |Coin Review| rivet trader Today I prepared a new idea for you. Like and subscribe to the channel there is a lot of useful information✅
Trend line retest entry ($2.630)
Sample deal plan:
-Entrance 2.630
-Stop-loss $2.423
-Take profit 2.995$
Stop set a little below the trend line, may give a false takeaway.

RUNEUSDTim keeping an eye on this one, it on a slight retracement,i highlighted two level in purple where i expect to see the market reaction and reverse back to the upside playing between the tunnel as indicated in the graph.
please do your own research this is just me thinking out loud how i see the market.

RUNE/USDT, shortStrong S/R being tested for the first time. I would be suprised if it pushed at once.

Mid-Term Bullish ScenarioTHORChain - Decentralized Liquidity Network Mid-Term Bullish Scenario !
If things go well for Alts, then this wave should be very profitable..
The gray zone is a solid resistance, once this level broke, it will fly.
(Chart is in Log Scale).
NFA/DYOR.


$RUNE close above 8 ema on the weekly with the macd about to cross this should pop quick
targets on chart invalidation red line