RUNEUSDTIt looks like the supply zone will fall down. The next supply is not bad, but the imbalance is not strong
RUNEUSDT.PS trade ideas

RUNEUSDT needs to create a new breakout to continueCurrently, the price of RUNEUSDT is testing a previous support level which has now become a resistance level. This means that the price had previously been supported at this level, but after falling below it, the level now acts as a barrier to further upward movement.
As traders, we are waiting for a breakout to occur, which means that the price will move above the resistance level and continue to rise. To prepare for this potential breakout, we can apply Plancton's Rules, which are a set of guidelines for entering long positions in an upward trend.
According to Plancton's Rules, we would wait for the price to break above the resistance level and close above it for at least one or two candles. Then, we would look for a pullback to the resistance level, which should now act as support. If the price bounces off this support level, we can enter a long position with a stop loss below the support level.
We would also look for additional confirmation that the upward trend is continuing, such as increasing volume .By following Plancton's Rules, we can enter a long position with a good risk-to-reward ratio, as we are entering the trade at a support level with the potential for further upside movement.
–––––
Follow the Shrimp 🦐
Keep in mind.
🟣 Purple structure -> Monthly structure.
🔴 Red structure -> Weekly structure.
🔵 Blue structure -> Daily structure.
🟡 Yellow structure -> 4h structure.
⚫️ Black structure -> <= 1h structure.
Follow the Shrimp 🦐

RUNEUSDT (Daily) - Bullish wave LTFHi Traders
RUNEUSDT (Daily Timeframe)
A medium-high probability, entry signal to go LONG will be given with the upward break of 1.840 after the market found support at 1.590. Only the downward break of 1.590 would cancel the bullish scenario.
Trade details
Entry: 1.810
Stop loss: 1.590
Take profit 1: 2.200
Take profit 2: 2.580
Score: 7
Strategy: Bullish wave LTF

RuneUsdt close to pumpRunerealy need break this resistance line and close for pump up
but BTC should save position.
btc ad market can save position adn not dump again . Rune can pump and so close to that
i think new week good for Rune.
GL
EntryPoint:
1.770
1.734
1.600
Supports:
1.500
1.400
1.285
1.150
Resistance:
1.867
1.895
Targets:
2.060
2.232
2.418
2.708
3.130
3.761
4.140
4.750
Midtime:
6.150
7.400
9.350
HODL:
12.100
14.543
18.380
GL

SHORT RUNE/USDTi will enter a short position oon RUNE USDT
50% of position here at 1.767
take profit 1.746
STOP LOSS 1.801
50% of position at 1.789
take profit at 1.73
stop loss 1.801
/follow for more

Long Term Investment on RUNERUNE is currently down for about 91% from its ATH. Meaning, if you buy now and it goes back to its ATH, you may have more than 10x profit.
Even if it doesn't go to its ATH, some possible scenarios:
- Closest support-turned resistance = 92% potential gain
- Closest weekly high = 5x profit potential
More supporting data from indicator to support this thesis =
Broke out 21 EMA
RSI shows bullish divergence


$RUNE - ShortHello my Fellow TraderZ,
I see some Change - of - Character #ALTS on shorter TF.
$Rune - waiting to hit my entry around $1.78 to drop further towards $1.4, so here is SHORT setup. You may adjust your SL according to your R:R .
Look at the breakout candle which is supported by Vol.
Keep tight , very tight SL, market may go for SL hunt.
CHEERS!!!

RUNEUSDT - Short Trade after entryRUNEUSDT Short - Binance Future
ENRTY Target: 1.829
TP 1: 1.797
TP 2: 1.798
SL: 1.863
Wait for the entry target

rune longbeautiful textbook pattern in #rune
ascending pattern will be waiting for the breakout above 1.95 first for clear 40-50% ride ....

RUNEUSDT...easy to use chartBINANCE:RUNEUSDT
1) DO NOT FOLLOW MY TRADES...i am here to share my analysis (and make u POOR AF)
2) i DO NOT HAVE A PRIVATE TELEGRAM CHAN. bc i don't need ur money, i'm making my own.
3) why would anyone who is making money, make money from selling trade ideas? he is already making MONEY!!
look at the chart, no need to explain further
but keep in mind, need a "CONFI-bar" to enter a buy trade
next target is to be 1.900$
#stop_being_poor

RUNE. Inverted head and shoulders.Global descending channel with inverted head and shoulders formation. The breakdown target is $2.38. In addition to this pattern, we have a golden cross formed and the price should cross over the week in which this cross was formed.

🔥 RUNE Bullish Channel: Patience For Break Out!RUNE has been trading inside a bullish channel for around three weeks now. In my view, this is exceptionally bullish, since we're making higher-lows and higher-highs all the time.
Often, a bullish channel will result in a violent break out with huge gains as a result. Personally, I'm waiting for said break out to occur. Be patient.
Targets in blue.

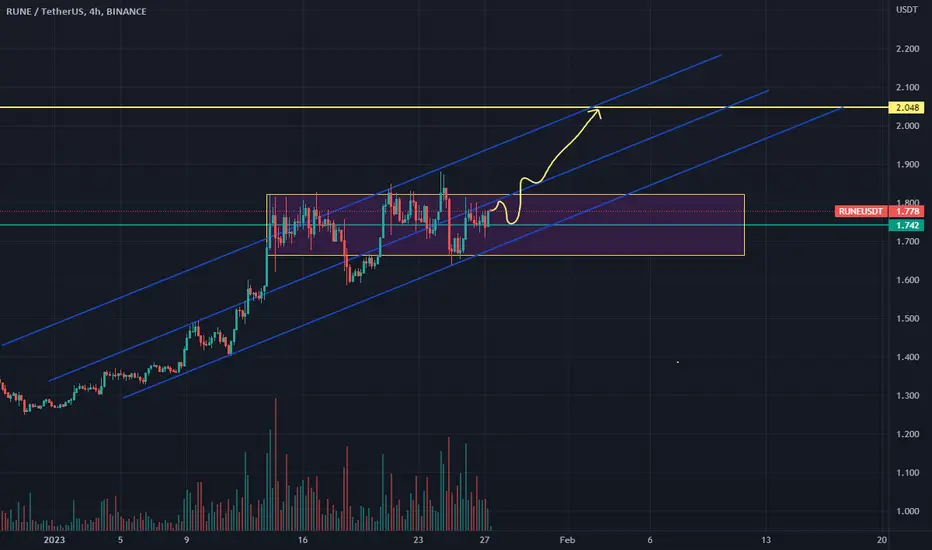
Rune breakout of the rectangle is immenent..Wait for the support or breakout of the box.. $2 is the target
Smash up the like button if you like my idea. Thx.. :)
RUNE/USDT AnalysisFor the past few weeks whole market has been green all the way. But recently it is forming up bearish channel/patterns (ETH, BNB, MATIC etc). For RUNE it has formed up clean bearish channel which you could see here. For my analysis, RUNE could face big drop in coming few days! Watch out!

#RUNEUSDT 4H Chart
Price is overall still in an ascending channel. MACD is starting to show some bearish momentum, RSI is sold and EMAs are neutral. I expect price to retest the support line around $1.75 before potentially continuing to move up. This support line has been tested many times however which makes it weak so longs would still be risky. Waiting for confirmation.

RUNEUSDT #LQRUSDT #TOBTC #LaqiraProtocol Price below resistanceprice below the EMA200 Daily and static resistance at price $2.042
important resistance $2.184
support $1.68

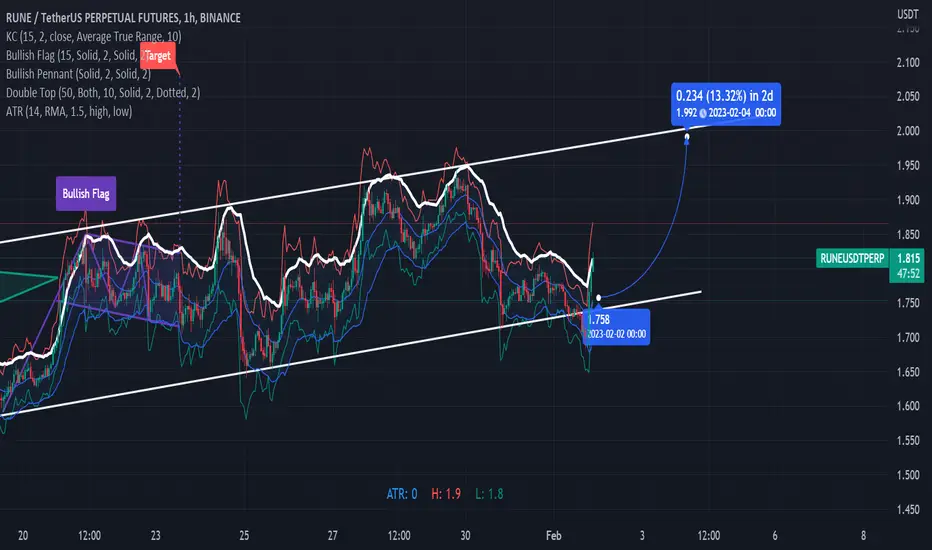
Rune bullish pennantTarget on this is 2.22 20% up from here we ar currently at a support and retest from current recent highs

#RUNEUSDT 4H Chart
Price is still ranging in an ascending channel and it is currently close to retesting the resistance line. MACD is showing strong bullish momentum, RSI is bought and EMAs are neutral. I expect price to break through this resistance line and keep moving up aiming towards the 4h supply zone at $2.16.

Rune back on trackWe are back on track to go to 2 $ tight stoploss is just below the trendline i have drawn
a looser Sl would be the 1hr ATR @1.65

RUNEUSDT
✅ ✅ Risk warning, disclaimer: the above is a personal market judgment and analysis based on published information and historical chart data on The trading view,
And only some of these analyzes are my actual real trades.
I hope Traders consider I am Not responsible for your trades and investment decision.
