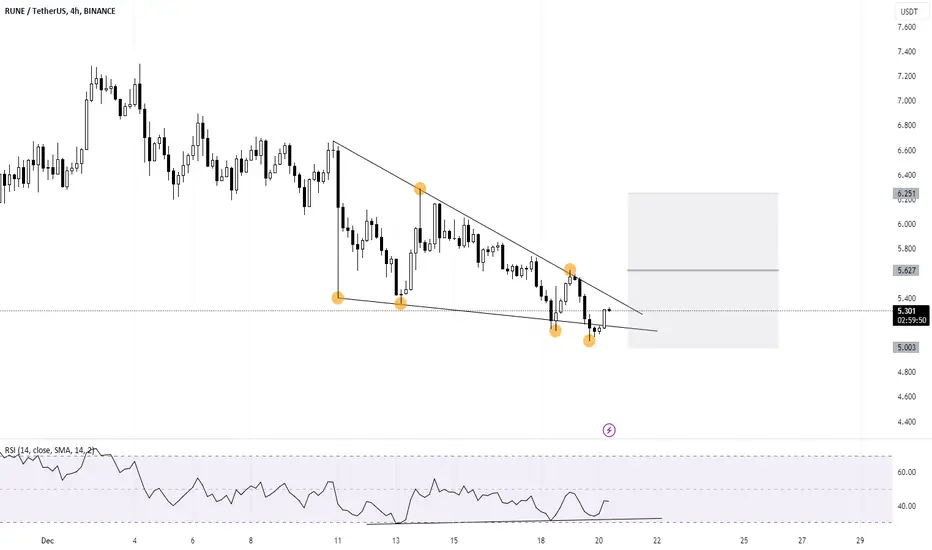
RUNE/USDT The breakout for a long trade in has been confirmed!The chart clearly indicates that RUNE has broken out of its resistance. Now is an opportune moment to initiate a long trade.
#POLYX/USDT LONG SCALP 🍀
Leverage: 3x
Entries: $5.940
Take profit 1: $6.291
Take profit 2: $6.850
Take profit 3: $7.205
Stop Loss: $5.353
Stay tuned for trade confirmation and additional updates. Feel free to express your thoughts by liking and sharing in the comments section:)
Thanks
The sroced. BINANCE:RUNEUSDT.P
RUNEUSDT trade ideas

Rune "Riding the Wave: A Strong Buy Signal Emerges!"**Thorchain (RUNE) Fundamental Analysis**
**Overview**
Thorchain is a decentralized cross-chain liquidity protocol that allows users to swap native assets between different blockchains without the need for wrapping or pegged tokens. It is powered by its native token, RUNE, which serves multiple purposes within the network, including:
* **Staking:** Staking RUNE helps secure the network and earn rewards in the form of RUNE and other supported assets.
* **Governance:** RUNE holders have the right to vote on network proposals and participate in the governance of Thorchain.
* **Liquidity Provision:** Providing liquidity to liquidity pools on Thorchain allows users to earn yield from transaction fees.
**Fundamentals**
* **Unique Value Proposition:** Thorchain's native asset swap functionality provides a unique value proposition compared to other cross-chain protocols that rely on wrapped or pegged tokens.
* **Growing Decentralized Exchange (DEX) Ecosystem:** Thorchain's ecosystem is expanding with the addition of new DEX interfaces and the development of new features like dual liquidity and savers vaults.
* **Strong Community Engagement:** Thorchain has a vibrant and engaged community that is actively involved in the development and governance of the project.
**Recent News**
* **THORChain Price Upswing:** RUNE's price has been on an upswing in recent months, reaching over $5.00 in December 2023.
* **Cosmos Integration:** Thorchain announced its integration with the Cosmos Hub, which allows users to swap assets between the Cosmos ecosystem and other supported blockchains.
* **Expansion of Validator Nodes:** The number of validator nodes on Thorchain's network has continued to grow, increasing the network's security and decentralization.
**Disclaimer**
Cryptocurrency investment is inherently risky, and past performance is not a reliable indicator of future results. Please do your own research and consider your financial situation before investing in any cryptocurrency, including RUNE.

Resersal for RUNEHead and shoulder in play for RUNE. After a price correction room is set for a reversal pattern.

RUNEUSDTshort idea on RUNEUSDT
taking a sell on the marked supply order block after price takes out inducement (marked as xxx).

Trade signal | THORChain (RUNE) setup for the next pumpHi dear friends, hope you are well and welcome to the new trade setup of THORChain (RUNE) with US Dollar pair.
Previously we caught more than 400% pump of RUNE as below:
On a 4-hr time frame, RUNE has formed a bullish AB=CD move for the next pump.
Note: Above idea is for educational purpose only. It is advised to diversify and strictly follow the stop loss, and don't get stuck with trade.


Rune ideaRune has shown strong indications that this trend might be over.
You can look for Sell positions in the specified zone for mentioned Targets.

RUNEUSDT (4H) - Bullish reversalHi Traders
RUNEUSDT (4H Timeframe)
Waiting for the upward break of 5.63 resistance level, which will complete a bullish trend reversal pattern to go LONG. Only the downward break of 5.05 would cancel the bullish scenario.
Trade details
Entry: 5.63
Stop loss: 5.05
Take profit 1: 5.98
Take profit 2: 6.56
Score: 7
Strategy: Bullish reversal

RUNE - Respecting Trend
Rune is trying to bounce off our purple macro trendline that we outlined in the post above. If we are able to break our white trendline of resistance we could see a move all the way to the 0.382 of our macro trend/ 1.618 of our micro trend. This means we could see our next level of resistance around $8.60-$9 if we are able to hold support around this $5 level.
Our Daily RSI is also trying to hold a structural level of support.

rule longRune Stones: Runes are characters or symbols that were historically used in ancient writing systems. Some people find the use of rune stones in divination or meditation practices intriguing. Each rune symbolizes specific meanings or energies, and people may use them for guidance or introspection.
"Rune Long": If you meant something else by "rune long," it could be a term or idea specific to a particular context, culture, or subject. Without more information, it's challenging to provide a precise response.

"Your strength is finished?👀
🔴"Buyers have started a tough battle. And so far, they have been able to increase the value of rune by 244 percent."✅
🔴"But have their strength run out❓"
🔴If buyers are unable to sustain the upward price movement, our first trigger is 5.231, with angry sellers and a break of the support line.🔆
🔴I think the buyers have used up their last strength. What is your opinion? Who do you think will win the battle?⚠️

RUNE may pamp soon?+ Good incoming volumes (13-14dec)
+ Clear support (can bounce now or later)
+ Clear resistance
+ Small volatility
This might still go lower to 5.780. A good opportunity to participate would be on a 6.0 breakout.

Don't buy RUNE too earlyI will wait to buy RUNE at 4.00. This support looks really strong, actually the price has broken the H4 trendline, we can also see a divergence on daily timeframe on my indicator. I will start accumulating spot entry at 4, target will be updated

Rune HTF analysis ●Rune is trading at the Daily +FVG
●It's crucial for Rune to hold $5.729 level and $5.510 level mean Rune should not give daily candle closing below these levels.
●Hodling these levels mean Rune will go up for $7.777 and the main target $9.891
●losing $5.729 & $5.510 then we might see Rune go down for $4.550 and $4.035 levels...
●$4.550 & 4.035 Will be the buying zone for Rune

RUNE Short setupRUNE in last impulsive wave which is 5th wave currently trading at previous high easliy can break that we may see fast move from here to short squeeze then will crash very hard from there 30-40%
DYOR

RUNE is turning to bearish trendOn the chart, we have an important level, which we determined that if we have several 4-hour candles under this level, the bearish view on the rune will increase, and the second confirmation is a bearish ch, which, if it occurs, can drop the price to the green area.
For risk management, please don't forget stop loss and capital management
Comment if you have any questions
Thank You

RUNE channelization analysisThis is an analysis based on channelization.
Remember that most of the time everything is reflected in the chart and you should look for signs.
We have had a diagonal channel that the price has faked out twice, which shows selling pressure.
We have also had a dynamic support that has been broken and the price has not been able to recover it.
Now all buyers will become sellers and RUNE will experience a lot of selling pressure.
The bottom channel is the adjacent channel.
I specified the targets.

RUNE FIRST ZONE HIT, ABOVE THERE ARE TWO MORE ZONESI will post below where I set the zones earlier, and the first one was hit. The day has not closed yet, so you should be careful. Keeping the price below 6.5$ is a success for this trade
POC from 1. July-13.MAY.
From the other levels we have, it is weekly $7.9, VAH of the same range and full liquidity at 11.6
It is up to you which zone you choose, and how you enter the trade

RUNE USDT: SOLD ALL OF MY RUNE... I sold my first 50% on my previous chart that I failed to gauge the right top.
Now, here I am again thinking that this will be the top. Relatively it is. More on sentiment reasons. I will not explain further, since the explanation are very much the same with the previous chart I did. Here it will be just a bit more detailed and applied with sentiment.
SOLD 6.9 I just find it funny, and related to the fibs. Tried to drag it further while still respecting the levels. Thank you. PS: I added Trend line. I will short accordingly.

Just a quick TA on RuneKeep an eye on the current resistance & trendline. If RUNE is not able to break support on trend-line either it breaks the resistance or not, Long would be the good option.

RUNE TAKE PROFIT OR QUICK SHORT An explosion that needs to end. I said that I'm still optimistic about this coin, but profit has to be taken somewhere.
Important levels marked, it's up to you how you will enter/exit.
Divergences are slowly showing, but I am of the opinion that we can go even higher for that liquidity

RUNE Overhead Resistance
It may go up a bit higher, but I can see some overhead resistance on the logarithmic chart.
Looking for a retracement to mid $4.
