Run big short to $0.935I made a post right when I took this trade but I had included links in the caption here and apparently it violated tradingview policy and it was removed and I was banned for 24hrs.
So this is continuation of that post for anyone following who might have took it and now wondering what happened. I did close our early I believe then scale into the position a couple times. The full history is on my X page.
Stop is now at $1.1125
RUNEUSDT trade ideas

TradeCityPro | RUNE: Decoding Its Descent in DeFi Markets👋 Welcome to TradeCity Pro!
In this analysis, I want to discuss the RUNE coin, which was requested in the comments of yesterday's analysis. This project is one of the DeFi projects, with a market cap of $383 million, ranking 118th.
📅 Weekly Timeframe
In the weekly timeframe, as you can see, it has started a downward leg from the peak of 6.894 and is moving downwards, reaching the area of 1.110.
✔️ Currently, it seems that the downward momentum has slightly decreased, and the price is moving downward more slowly. The RSI oscillator is also near the 30 area, ready to enter into Oversell and introduce a new downward momentum into the market.
💫 If this occurs and the price consolidates below 1.110, the next support will be 0.816, which is a very important floor, and if this area breaks, the last support the price will have is 0.386.
🔑 On the other hand, if the price is supported at 1.110 and breaks the trend line that the price has, we can confirm a trend change and the start of a new upward trend. The main trigger will still be 6.894.
📅 Daily Timeframe
In the daily timeframe, the price has a range box between 1.091 and 1.504, and after the downward leg following the break of 3.210, it has now entered a ranging phase and is ranging in this area.
🔽 For a short position, given that the price has hit a lower high compared to 1.504, the likelihood of breaking the floor of the box is high, and with the break of 1.091, we can enter a short position.
📊 An important point is that the market volume in this range box has decreased significantly and keeps decreasing. With the entry of volume in any direction, the market can start moving in that direction.
📈 If buying volume enters the market, the first long trigger is the break of the 1.504 area. This area overlaps with the 0.236 Fibonacci, and breaking this area, the next important levels are 0.382, 0.5, and 0.618 Fibonacci.
📝 Final Thoughts
This analysis reflects our opinions and is not financial advice.
Share your thoughts in the comments, and don’t forget to share this analysis with your friends! ❤️

RUNE - Perfect almost Sniping precise levelsIt was almost sniping.
What a beautiful Signal. 👌 🎯
Look how those Levels were respected.
1️⃣) Short from blue box to Fib 0.66 = 6.8 % 💵💲
2️⃣) Short under Blue Box (after BTC fake out) to VAL about 12 % 💵💲
Here my Original Signal/TA:
Follow for more ideas/Signals. 💲
Look at my other ideas 😉
Just donate some of your profit to Animal rights and rescue or other charity :)✌️

Rune short to $1.125 or lowerJust now opened a short position on rune.
Aiming for $1.125 area to exit for 2RR. Depending on the market momentum I might opt to hold a bit longer.
DTT setup.
Time sensitive.

RUNE - Some interesting Levels/POIsEyes on these levels.
Especially VAH and blue box for small Short.
Wait until it reaches there and new small TA regarding Volume then decide to Short.
That blue box could be a rotation level too!
Follow for more ideas/Signals. 💲
Look at my other ideas 😉
Just donate some of your profit to Animal rights and rescue or other charity :)✌️

THORChain (RUNE) to $5On the above 4 day chart price action has corrected 90% since March 2024. A number of reasons now exist to be long, they include:
1) Price action and RSI breakouts.
2) Price action confirms support on past resistance.
3) Regular bullish divergence.
4) Expect a rally to the $5 area before downtrend continues.
Is it possible price action corrects further? Sure.
Is it probable? No.
Ww

RUNEUSDT 1WRUNE ~ 1W Analysis
#RUNE Buy gradually from here with a short -term target of at least 20%+.

Rune short back to $1.00Opened a short trade on Rune just now. I anticipate that we'll have a big dump and that we'll push down to the $1.00 area again.
However along the way I have a few areas where I'll be looking to potentially take profit and maybe scale back in at a later time if it makes sense.
That is given the trade actually plays out according to my DTT strategy.
Anticipating a push down soon else I'll likely get stopped out.


RUNE/USDTHere i can see the best spot opportunity in RUNEUSDT as it is now on it's most important support level as it respect it's Support level it may show some good rally.

#RUNEUSDT is showing signs of growth📈 Long BYBIT:RUNEUSDT.P from $1.161
🛡 Stop loss $1.140
🕒 1H Timeframe
⚡️ Overview:
➡️ The main POC (Point of Control) is at 1.08, indicating the area with the highest trading volume.
➡️ The 1.154 level acts as a local support, as the price previously bounced from this zone.
➡️ The volume and market profile highlight areas of high trader activity, especially in the 1.100 – 1.161 range.
🎯 TP Targets:
💎 TP 1: $1.174
💎 TP 2: $1.185
💎 TP 3: $1.195
📢 Monitor key levels before entering the trade!
📢 If 1.140 is broken downward, the trade may be invalidated.
📢 If the price holds above 1.161 and continues rising, the bullish momentum remains intact.
BYBIT:RUNEUSDT.P is showing signs of growth — expecting further upside movement!

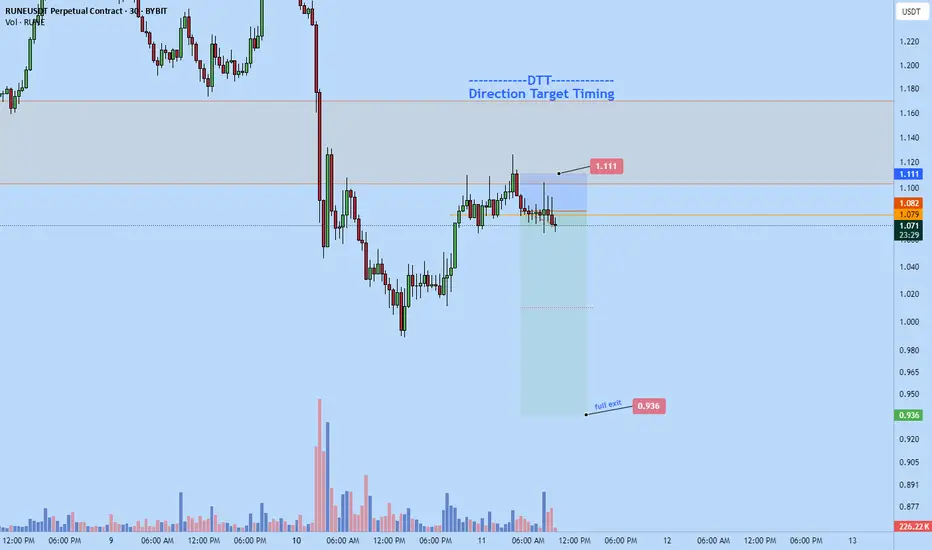
Rune dump to $0.936I recently entered a short on Rune. I think we about to dump down now . Down to $0.936 . Thats where am looking to full exit ideally.
RUNE/USDT Technical AnalysisRUNE/USDT Technical Analysis
1. Current Market Conditions:
- Price trading at 1.079 USDT
- Showing signs of recovery from recent downtrend
- Volume increasing on recent bullish moves
- Currently testing resistance levels
2. Key Technical Levels:
- Major resistance at 1.214 USDT
- Immediate resistance at 1.192 USDT
- Support established at 1.006 USDT
- Secondary support at 0.980 USDT
3. Technical Indicators:
- Price attempting to break above EMA cluster
- Potential bullish reversal forming after 70% retracement
- Volume profile showing accumulation at current levels
- Early signs of trend reversal with higher lows forming
Trading Recommendations:
1. Short-term Strategy:
- Look for long entries near 1.066 USDT support
- Initial target at 1.192 USDT
- Stop loss below 1.006 USDT
- Consider scaling in positions on pullbacks
2. Risk Management:
- Maximum position size 1-2% of trading capital
- Use tight stops due to high volatility
- Consider partial profit taking at resistance levels
- Leverage should be kept minimal (1-2x maximum)
3. Key Points to Monitor:
- Break above 1.192 could trigger stronger rally
- Watch for rejection at EMA cluster
- Volume confirmation on breakouts
- Overall market sentiment affecting alt coins
Summary: RUNE shows potential bullish reversal signs after significant downtrend. Conservative traders should wait for confirmation above 1.192 while aggressive traders can look for entries at current levels with strict risk management.

Runeusdt Buy opportunityRUNEUSDT exhibits a potential symmetrical triangle formation, with price accumulating near the lower boundary of the pattern within a key external demand zone. The structure suggests a consolidation phase, with a breakout from this range likely to dictate the next major move.
A bullish expansion from this level could drive RUNE toward the main supply zone around $7.25, aligning with previous structural rejections and the descending trendline resistance. A breakout above this zone would confirm bullish momentum, targeting the $20.40 high.
However, failure to maintain support within the demand zone may expose RUNE to further downside, with key support around $2.55

Rune is going to bounce backRune is sitting in potential bouncing support BYBIT:RUNEUSDT
Entry 3.70
Target 5.00
Stop 2.49

RUNEUSDT Short-term price analysis Here are three potential TPs for today for RUNEUSDT, considering it does not break above the 1H trend line.

RUNE Long OpportunityMarket Context:
RUNE has been trading within a range for the past few weeks, and price has now retraced to the lower support level of this range. This presents a solid opportunity for a long entry targeting the next resistance levels.
Trade Details:
Entry Zone: $1.18
Take Profit Targets:
$1.30 - $1.35
$1.45 - $1.60
Stop Loss: Just below $1.10
This setup offers a strong risk-to-reward ratio, with potential for range-bound trading before a breakout. 🚀

Rune - Thorchain: A Mid-Term Opportunity Too Good to IgnoreThorchain (RUNE) presents a compelling short-to-midterm opportunity that’s hard to pass up. Despite reports suggesting that North Korean hackers have used it to launder stolen Ethereum, the technical indicators are extremely bullish.
Volume: One of the highest levels we've seen in a long time.
RSI: Oversold on the weekly chart, signaling a strong potential for a rebound.
Midterm Target: A 5x to 6x increase.
This looks like the best buying opportunity at the moment—unless I’m overlooking something fundamental. If I am, feel free to share your thoughts in the comments. Thanks!

RUNE sell/short setup (4H)The RUNE token, after experiencing heavy drops due to negative news, is now trading within a range.
A price top has been fake out, leading to a drop. On a retracement to higher levels, we can look for a sell/short setup.
We have identified two entry points for a short position.
Targets are marked on the chart.
A daily candle closing above the invalidation level will invalidate this view.
For risk management, please don't forget stop loss and capital management
Comment if you have any questions
Thank You

RUNE BUY as an option to win bigThe Rune and the Thorchain have good economics behind the project.
The Validators get nice compensation for their work.
All the team needs to do is:
1. Make sure that the network is safe
2. Borrow long-term money to cover the financial hole
3. Enjoy the business
Now, the price is at the lowest level since the introduction of the Rune. It is a good opportunity to take a position and enjoy the flight.
The Rune is going to be $4 pretty soon if the above 3 conditions are met

RUNE is rocket !#RUNE made a super down spike from its top ! i think this coin is at the end of the bearish road also the price hit a demand zone which can make this coin rise again but first we need crossing the confirmation line and the first TP is the supply zone !

RUNEUSDTM
W
D
This currency has reached an important area with its correction and could see
targets of
2.53
4.36
9.80
21
in the future.
The area of
1.12 and
0.62
is a great place to enter...Don't forget about money management.

RUNE ACCUMULATION PHASEIf you can see the chart this way, you are probably a day trader. You can clearly identify the levels of support, resistance, and accumulation zones. It's easy to trade ranges like these.
Currently, RUNE is accumulating well, but you should be careful because of BTC. As I mentioned previously, it could go lower. No one knows how RUNE will react to this, but it could potentially enter a dip zone and form a second bottom on the 1W chart. The 4H chart may be forming a local trend with a clear trendline at 1.330, but be careful.
