Retracement on THORChain after its strong bullish move?After a very impressive performance of +120% in 12 days, RUNE is now showing some signs of weakness, with sell signals on the Strength Reversion (BSR), while the Rainbow Score (BRS) is approaching the red zone. We could possibly look for an entry-level buy around the $1.15 level, before continuing the upward trend.
RUNEUSDT trade ideas

RUNE/USDT - THORChain: Resistance_Breakout◳◱ A Resistance Breakout has been identified on the CRYPTOCAP:RUNE / CRYPTOCAP:USDT chart. The price has broken above a key resistance level, indicating a potential bullish trend. The next resistance key levels are located at 1.701 | 1.814 | 2.079, and the major support zones can be found at 1.436 | 1.284 | 1.019. Consider entering at the current price zone of 1.59 and targeting higher levels.
◰◲ General info :
▣ Name: THORChain
▣ Rank: N/A
▣ Exchanges: Binance, Kucoin, Bybit, Gateio, Poloniex, Mexc
▣ Category/Sector: N/A
▣ Overview: THORChain project overview is currently unavailable. I'll try to update this in the upcoming analysis.
◰◲ Technical Metrics :
▣ Mrkt Price: 1.59 ₮
▣ 24HVol: 6,243,173.236 ₮
▣ 24H Chng: 2.647%
▣ 7-Days Chng: N/A
▣ 1-Month Chng: N/A
▣ 3-Months Chng: N/A
◲◰ Pivot Points - Levels :
◥ Resistance: 1.701 | 1.814 | 2.079
◢ Support: 1.436 | 1.284 | 1.019
◱◳ Indicators recommendation :
▣ Oscillators: SELL
▣ Moving Averages: STRONG_BUY
◰◲ Technical Indicators Summary : BUY
◲◰ Sharpe Ratios :
▣ Last 30D: N/A
▣ Last 90D: N/A
▣ Last 1-Y: N/A
▣ Last 3-Y: N/A
◲◰ Volatility :
▣ Last 30D: N/A
▣ Last 90D: N/A
▣ Last 1-Y: N/A
▣ Last 3-Y: N/A
◳◰ Market Sentiment Index :
▣ News sentiment score is N/A
▣ Twitter sentiment score is 0.70 - Bullish
▣ Reddit sentiment score is 0.76 - V. Bullish
▣ In-depth RUNEUSDT technical analysis on Tradingview TA page
▣ What do you think of this analysis? Share your insights and let's discuss in the comments below. Your like, follow and support would be greatly appreciated!
◲ Disclaimer
Please note that the information and publications provided are for informational purposes only and should not be construed as financial, investment, trading, or any other type of advice or recommendation. We encourage you to conduct your own research and consult with a qualified professional before making any financial decisions. The use of the information provided is solely at your own risk.
▣ Welcome to the home of charting big: TradingView
Benefit from a ton of financial analysis features, instruments and data. Have a look around, and if you do choose to go with an upgraded plan, you'll get up to $30.
Discover it here - affiliate link -

RUNE/USDT - THORChain: Resistance_Breakout_Confirmation◳◱ A Resistance Breakout and Confirmation has been detected on the $RUNE / $USDT chart. The price has broken above a key resistance level and has been confirmed by a strong candle, indicating a potential bullish trend. The next resistance key levels are located at 1.519 | 1.604 | 1.802, and the major support zones can be found at 1.321 | 1.208 | 1.01. Consider entering a trade at the current price zone of 1.652 and targeting higher levels.
◰◲ General info :
▣ Name: THORChain
▣ Rank: N/A
▣ Exchanges: Binance, Kucoin, Bybit, Gateio, Poloniex, Mexc
▣ Category/Sector: N/A
▣ Overview: THORChain project overview is currently unavailable. I'll try to update this in the upcoming analysis.
◰◲ Technical Metrics :
▣ Mrkt Price: 1.652 ₮
▣ 24HVol: 14,598,026.973 ₮
▣ 24H Chng: 5.492%
▣ 7-Days Chng: N/A
▣ 1-Month Chng: N/A
▣ 3-Months Chng: N/A
◲◰ Pivot Points - Levels :
◥ Resistance: 1.519 | 1.604 | 1.802
◢ Support: 1.321 | 1.208 | 1.01
◱◳ Indicators recommendation :
▣ Oscillators: NEUTRAL
▣ Moving Averages: STRONG_BUY
◰◲ Technical Indicators Summary : BUY
◲◰ Sharpe Ratios :
▣ Last 30D: N/A
▣ Last 90D: N/A
▣ Last 1-Y: N/A
▣ Last 3-Y: N/A
◲◰ Volatility :
▣ Last 30D: N/A
▣ Last 90D: N/A
▣ Last 1-Y: N/A
▣ Last 3-Y: N/A
◳◰ Market Sentiment Index :
▣ News sentiment score is N/A
▣ Twitter sentiment score is 0.70 - Bullish
▣ Reddit sentiment score is 0.76 - V. Bullish
▣ In-depth RUNEUSDT technical analysis on Tradingview TA page
▣ What do you think of this analysis? Share your insights and let's discuss in the comments below. Your like, follow and support would be greatly appreciated!
◲ Disclaimer
Please note that the information and publications provided are for informational purposes only and should not be construed as financial, investment, trading, or any other type of advice or recommendation. We encourage you to conduct your own research and consult with a qualified professional before making any financial decisions. The use of the information provided is solely at your own risk.
▣ Welcome to the home of charting big: TradingView
Benefit from a ton of financial analysis features, instruments and data. Have a look around, and if you do choose to go with an upgraded plan, you'll get up to $30.
Discover it here - affiliate link -

RUNE USDT pair short squeeze time Rune USDT pair had good move since Aug 2023 , holding very strong .before correction high chance to go upward 15% move to squeeze short position ,we need one candle close above 1.6$ area
Targets on chart

RUNE going UpGood volumes have been poured into the instrument, it is trading at very high volumes of 745m, low correlation with BTC, which also says that there is a major player in the coin, a resistance level has formed at 1.555, where we have been trading for some time, I expect another small trade after a smooth approach to the level and an impulse breakdown of 3-5%, I will go on good activity in the glass in the corroding density.

Short RUNEUSDT from 1.345Short RUNEUSDT from 1.35, Initial Target 1.3 then 1.2 and will hold rest of 25%
Current high is SL

Rune is Ready For Running?Here is My Study On Rune.
Welcome to my channel! Here you'll find daily technical analysis ofthe latest trends in the crypto market. From Bitcoin to altcoins, I'lll be sharing my insights and predictions to help you make informed decisions .Not a Finacial Advice

Sell... Keep it simple stupid, remember.We head North..📉
Ought to have Entered earlier but was waiting for the Retest to the 1.500 Zone, of which it did and bounced off it.
Which is now sending it to the 1.350 Zone as TP 1, 1.271 TP 2 and 1.164 as TP 3.
⛔⚠ Please DYOR.
Good Luck 👍🏻

RUNE USD pairRUNE USD pair shows bullish rectangular pattern and it seems that after sideways movement it will go up and continue its bullish trend

Rune Long if breaks throuth 1.63 on Aug 17, 2023
Structure Breakout: waiting
Red -> Green
Context: Green
RUNE, RUNEUSD, RUNEUSDT, RUNEUSDT.P, CRYPTO, CRYPTOCURRENCY
DISCLAIMER
This is only a personal opinion and does NOT serve as investing NOR trading advice.
Please make your own decisions and be responsible for your own investing and trading Activities.

Rune - 1H major fallThe Rune price failed to achieve a higher high and even registered a lower low.
As a result, I'm anticipating a significant downtrend which is a pullback in the higher time frames.

RUNE/USDTHi,it is in hype our methodology is being inverse the crowd.....that is my short level on chart...
Good luck

rune shortHow to Trade Using the SMC Trading Strategy:
We would learn Smart money entry patterns and methods such as:
SMC Reversal Entries
How to identify valid CHOCH.
Major and Minor change of character (CHOCH)
Aggressive Entry setup
Entry Methods:
Firstly let us examine the entry method we can use in the SMC trading strategy. Smc entry methods are divided into two major subcategories namely:
The reversal entry method
The continuation entry method
The reversal entry method can further be divided into two namely:
Change of character (CHOCH) or change of market structure.
Flip entry setup.

RuneUsdt short setupRune price currently testing resistance and in reversal zone, short area and TPs mentioned on the chart. (Risky trade)

Resistance Ahead, Short Time is comingDaily Chart
Thor Chain BINANCE:RUNEUSDT soared very strong and now it's going up to resistance around 1.725
Wait a next move

Rune 1H ( Bearish Scenario ) After its recent 70% growth over the past few days, the cryptocurrency symbol Rune has reached the strong resistance level of $1.7 on the daily timeframe. Expecting a correction and a price reversal from this area is not out of reach
In lower timeframes, wait for confirmation to enter a short trade. Correction can potentially start from here, or it could initiate a correction by placing sell orders above $1.7. Keep an eye on it

RUNE : BACK TO R LEVELRUNE seems interesting for the low time frame, we will check in the coming time if this coin is able to break out to $1.68 and from there a confirmed building trend.
The reason for the update is the important small-time confirmation.
There is a good chance for a breakout in the coming time.

Rune at resistanceDotted line will react as resistance. Price will dump or consolidate here. You can go long after successfully breakout of dotted line otherwise better to wait

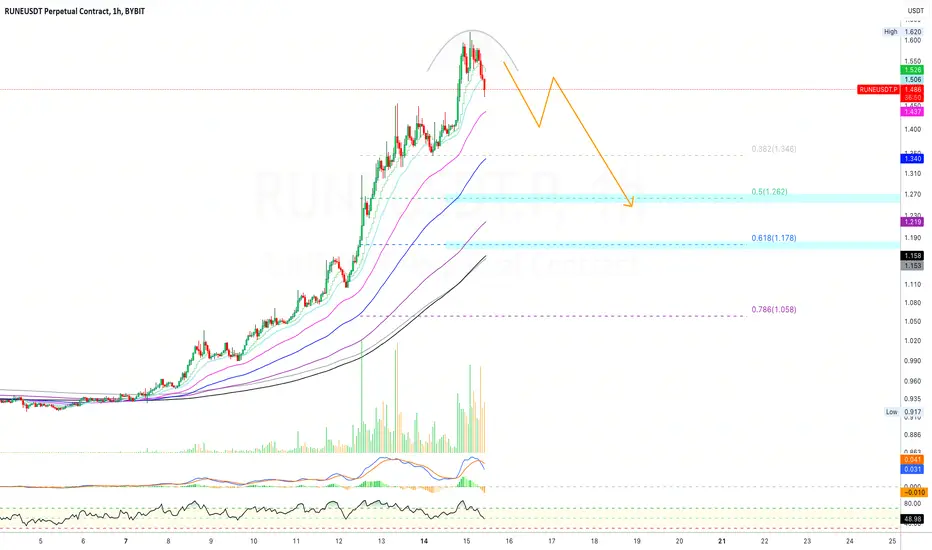
✴️ THORChain Short-Term ShortWhat goes up, must come down.
It is normal to see a correction/retrace after strong growth, this is the case for RUNEUSDT.
We saw a very strong rise in price and now we are witnessing a retrace.
After the retrace is over, we can expect additional growth.
Support levels can be seen on the chart.
Signals supporting this call are: Volume, inverted cup pattern, break below EMA21/10.
Namaste.
RUNEUSDT-SHORT SETUPThere is a bearish divergence on rsi. which is showing the weakness in trend. we can enter the market using sell stop order stop loss above the high targeting 1: 2. looking good for short

Rune/usdt recent update "RuneUSDT on Higher Time Frame:
As we said in our earlier analysis, Rune dropped by 10-15%, but it didn't reach our main target
For now I anticipate a correction of around 30-40% in Rune's price in the next few days. Overall, I am bullish
Remember, this is just an idea. Research before making decisions.
Best of luck! If you're happy with our content, please consider supporting us. Happy trading!"

RUNE USDT PERP Hello Trader BINANCE:RUNEUSDT.P
resistance area has been touched in 4 hours and positive reject for the short term. this is for scalping in the immediate area as the chart is dominantly bullish.
Please add a comment and Positive feedback and
constructive criticism are important to authors and the
community.
Disclamer: Not Financial Advice

