🔥 RUNE 1-Year Downtrend Break OutAs the title suggests, RUNE has now broken out through a 1-year resistance line that has kept the bulls in check. In my view, this could be the start of a bigger longer-term trend.
Since we're quite overbought at the moment, I'm, waiting for a small pull-back before considering an entry. Stop just below the resistance, target at the August 2022 highs.
RUNEUSDT trade ideas

Rune at resistance#Rune will go in 1.25 - 1.40 Range.
If it breaks red descending channel then it will enter in green Ascending channel and will start hitting targets 1.69 - 3.00
If it retest 1.10 range then it's ok but if any daily candle closed below it then risky.
This is just an update/analysis.
This is not a signal.
For complete signals with Entry Stoploss Tp
Contact @srtradersAdmin

Rune/Usdt Update Rune/usdt
In our previous discussions, we talked about a Rising Wedge / Bearish channel, but Rune doesn't seem to be following any bearish patterns
Right now, I think the price might go down by around 20-30% after it reaches the 1.40-42 level. Let's wait and see.
Remember, this is just an idea. Before making any decisions, do your own research.
Best of luck! 👑
If you're happy with our insights, please consider supporting us.
Wishing you successful trading!

Keep watching rune. Am gonna start building my short at 1.6. If the chances or opportunities create itself.

RUNE. Governance token for the descending channel.The price did not touch the upper border of the channel for almost 500 days. Assets with a capitalization like RUNE classically behave characteristically to patterns. We are testing the middle of the channel for the fourth time and imo it will be broken, besides, at the moment there is a positive info background on Twitter around RUNE and its bridge/swap. RSI also allows the upward movement to continue.
So, it is logical to expect 113% gain if your glass is half full... Or after testing the middle of the channel, the fall will continue if your glass is half empty.

$RUBE Adam and Eve Pattern Performing in 1dWhat is the Adam and Eve Chart Pattern?
Adam and Eve is a bullish and bearish reversal chart pattern that appears in a downtrend or uptrend. The pattern was first mentioned in the book Encyclopedia of Chart Patterns by Thomas Bulkowski, and until these days, it is a relatively unfamiliar classical chart pattern to many traders worldwide.
In essence, Adam and Eve is a variation of double top and double bottom patterns and is only slightly different from the traditional double bottoms/tops. The pattern is marked by the first bottom or top, the Adam, then the price moves up or down and creates another U-shaped where we can see Eve.
So, instead of having two peaks like in the double top or double top (or three peaks for the triple bottom and the triple top pattern), Adam and Eve is formed by two highs – the first is a peak while the other has a round shape.
Overall, it is an excellent chart pattern to find entry levels as it gives you double confirmation of the price failing to break above or below a specific price level.

Rune usdt order blocks analysis.In this chart i mentioned previous pull backs and mentioned how markets reacts in pull backs in retracement as a order blocks.

RUNEUSDT → Price breaks resistance after retesting the bottom BINANCE:RUNEUSDT is forming a prolonged downtrend. A global setup capable of changing the trend is being formed. After testing the bottom, the price starts to realize the bullish potential
The rebound from 0.777 (market bottom) forms a bullish reaction on the background of bitcoin growth. An active strengthening and breakout of the global trend resistance is formed. The price is sandwiched between local resistance at 1.110 and support at 1.003. A local consolidation may be formed with the subsequent retest of the upper boundary of the flat and realization of the breakout. This move may give the market a new potential and price growth. MA-50 acts as support and MA-200 as resistance. The height of the range is large and this gives scope for the medium term.
Support levels: 1.003, 0.777, MA-50
Resistance levels: 1.110
I expect a retest of 1.110 followed by a breakout and further growth to 1.433 or 1.722.
Regards R. Linda!

Rune short Run short set up for bearish BOS to a bullish OB
RSI over bought
possible 4 hour golden slap
bearish div in smaller time frames

RUNE USDT PERPHello Trader BINANCE:RUNEUSDT.P
rounding bottom usdt rune area in swing time frame (long term) 4 hours entry point area is on the yellow line
Please add a comment and Positive feedback and
constructive criticism are important to authors and the
community.
Disclamer: Not Financial Advice

Rune/Usdt Update Runeusdt
On the daily time-frame :
1. There's a bearish pennant, which suggests the price might go down.
2. If we notice 1 or 2 red candles at this resistance point, it could create a double top pattern, indicating more potential for a drop.
3. Rising Wedge Pattern Also Bearisg
Overall, we might see the Rune price go down atleast 15-30% if it gets rejected. Remember, we should wait for confirmation of the rejection.
Best of luck!
Note : This is just an idea, do your own research before taking any decision
Happy trading 👑
If you are satisfied with our work kindly make sure to support us.


Keeping an eye on #RUNE/USDT resistance zone in 4-Hour TF!Keeping an eye on #RUNE/USDT resistance zone in 4-Hour TF!
We can open Long on BO above the zone or short upon rejection. CRYPTOCAP:RUNE is testing the major PMH resistance.

RUNE Trade setup>>>>>I Have Tried My Best to Bring the best Possible outcome in this Chart.
As we can see some wickness in movement's appear and rsi show some negative divergence that maybe cuse RUNE do short correct for short time to Ex broken downtrend line.(IT's Risky plane)
Just if in short time price jump to 1.10 correction scenario be failed.
You can see situation of RUNE usdt in price chart In longer time frame.
All important resistance's in short- term marked on the chart.
It's Not a financial advise.
PLZ DYOR
With hopping success

Rune Possible short SupportsRune Possible short Supports
Entry 1: 1.056
entry 2 : 1.065
tp 1: 1.04
tp 2 : 1.00
Sl: 1.11

Rune/Usdt Potential Short SetupRune approaching potential rejection zone, buying and TPs mentioned on the chart.

Rune Looks Promising for MidtermSeems Like Has Already Bottomed Out Formed & Breaking Falling Wedge In 3 Days Tf Incase Of Breakout Expecting Massive Bullish Rally In case Of Successful Breakout Expecting Move Towards 5$


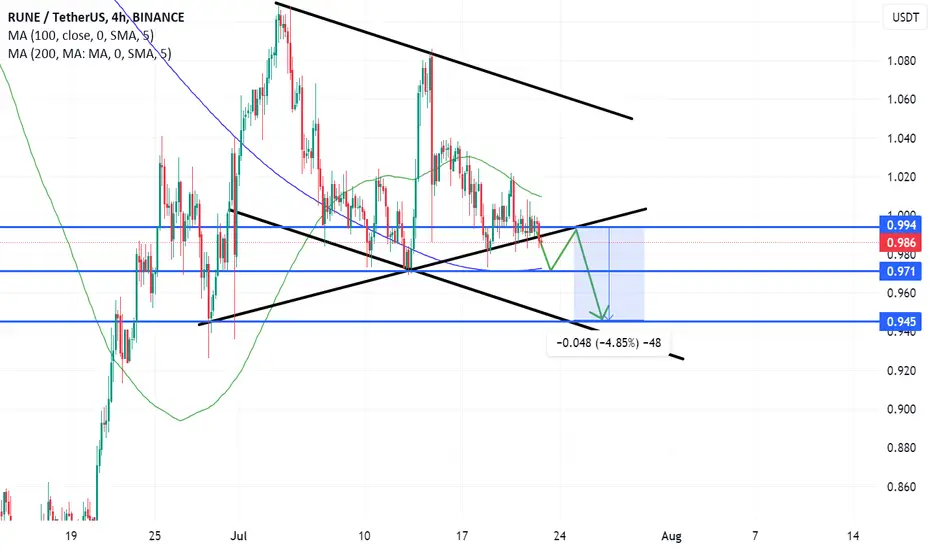
Rune Possible Playout ChartThe price movement of THORChain or Rune is predicted to experience a decline towards the $0.945 price area, with a percentage decrease of approximately -4.85%. This could be a good entry point for initial purchases. Currently, the Rune movement has confirmed a breakout and is expected to continue bearish. The decline is projected to reach the price of $0.971 temporarily before continuing further downward. #dyor (Do Your Own Research).
Will RUNE/USDT hit $21 Mean 40x From Here in Next BullRun?Analyzing the Bull Run Potential of RUNE/USDT: A Promising Investment Opportunity
The Previous Bull Run:
The last bull market for RUNE/USDT showcased an extraordinary performance for holders. Starting from September 21, 2020, with a price of around $0.322, the pair skyrocketed to $21.28 by May 17, 2021. This impressive rally resulted in a staggering 6626% increase within just 238 days, demonstrating the tremendous potential of the asset.
The Subsequent Bear Market:
Following the all-time high of $21.28, a bear market ensued. Over a span of 756 days, the price of RUNE/USDT plummeted by approximately 96%, reaching a low of $0.777 on June 12, 2023. This significant decline from the ATH presents an attractive opportunity for accumulation, with the expectation of future upward movement.
Accumulation Strategy:
Considering the current price level of $1.028, it is an opportune time to start accumulating. While a potential further 30-50% downward move is possible, attempting to predict the market with 100% accuracy is challenging. Therefore, gradual accumulation is recommended.
Entry Zones:
To capitalize on the anticipated price movement, two entry zones are proposed:
First Lot Entry: $1-$0.90
Second Lot Entry: $0.6-$0.5
Timing and Targets:
The expected price decline may occur towards the end of 2023, making the late 2023 and early 2024 period ideal for entering the market. With historical evidence of significant bull runs, the targets for the next uptrend are projected to be impressive.
TP1: $5/$10/$15/$20
This suggests a potential 40x increase from the bottom if Lot 2 entry zone is reached.
Key Levels:
Bullish Breakout Level: $1.40
Breaking this resistance level could trigger a skyrocketing price movement for RUNE/USDT.
Support Levels: $0.8/$0.5
Resistance Levels: $1.40/$3.50/$11
Disclaimer: This analysis is for informational purposes only and should not be considered as financial advice. Conduct thorough research and consult with a financial professional before investing in any cryptocurrency.
Follow us for More Quality Chart Analysis.
Thank you.

possible long for $RUNE at $1.17 will be breaking the down trend I will be looking for an entry after we flip the trendline on the weekly, and every tp on the way up.

RUNEUSD ❕ declineThe RSI chart is down in the sellers zone at 4H, 1H and 30m Timeframes.
50EMA has broken down 200EMA at 30m TF.
I believe the RUNE could continue to decline if it fixes below the support level.

RUNEUSDT (4H) - Bullish breakoutHi Traders
RUNEUSDT (4H Timeframe)
The market is in an uptrend, and we are waiting for an entry signal to go LONG above the 1.0410 resistance level. Only the downward break of 0.9690 would cancel the bullish scenario.
Trade details
Entry: 1.0410
Stop loss: 0.9690
Take profit 1: 1.0855
Take profit 2: 1.1575
Score: 7
Strategy: Bullish breakout
