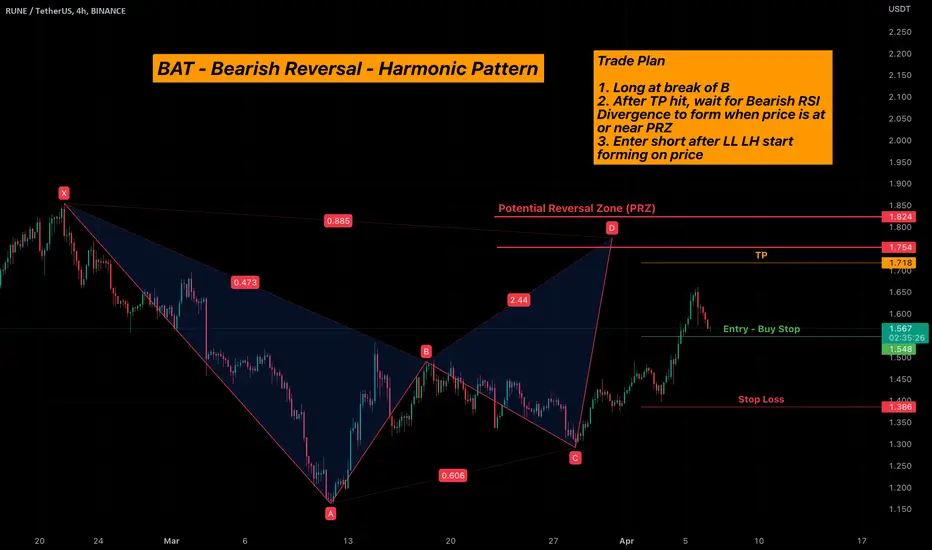
RUNE/USDT - BAT - Bearish Reversal Pattern - HarmonicsRUNE/USDT is currently forming a bearish reversal pattern. Expecting price to move up towards PRZ and start a bearish trend
RUNEUSDT trade ideas
RUNE : INCREASE VIEWRune seems to show an interesting view, we will follow it to see if it's able to confirm the coming time.

RUNE longRUNE broke trough the descending trendline. Asset broke trough the resistance level. Bullish movement to resistance level at 1.95 is expected to happen.


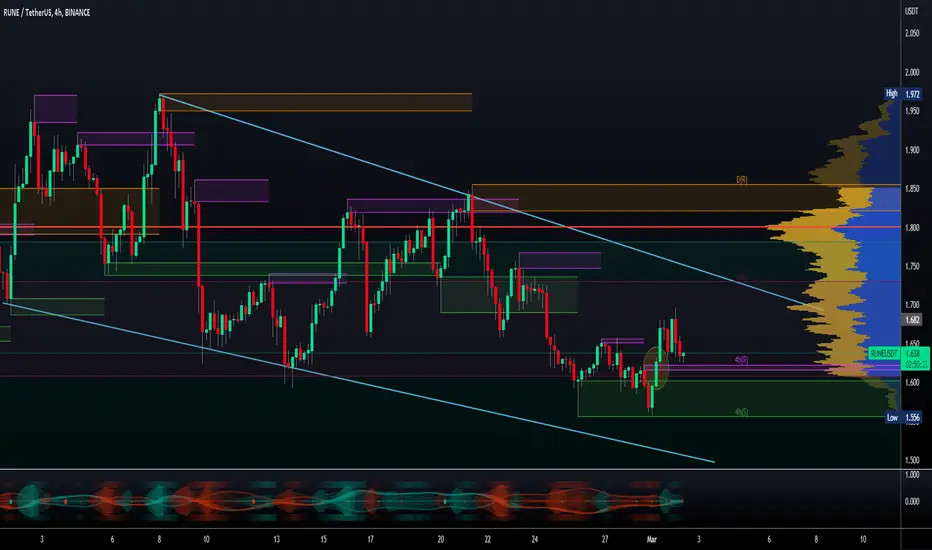
RUNEUSDTWe do have an active MTR on 4 hr chart,
Therefore, My entry price will be at 1.657 after break out where all Stop lost of sell positions will be trigerret,
targets are marked on chart,
Lets C

RuneusdHard to see the utility in cross chain swaps in a bear market but as soon as things heat up again chains will be going under and others will be performing well so assets between chains will be a thing again probably
Decentralized liquidity pools for cross chain swaps product launched early bear market
Alas crypto winter claims all altcoins accept for eth maybe but things are heating up again with the doge coin twitter logo so might see a mini distribution cycle across the board into April may this year
Successful claim and retest of that ema and the fib level would be the safest entry
Aggressive entry’s around here pre the claim of that zone
Target approx 2$

RUNE buy midtermI bought RUNE on a breakdown of the 1.5 zone. Stops are hidden under 1.38, a longer stop at 1.3. And the profit targets according to the chart markup 1.66 and 1.8.
Support for the author subscribe ✅ and start rocket 🚀.
Good luck and profits to all.

RUNEUSDT (Daily) - Bullish reversalHi Traders
RUNEUSDT (Daily Timeframe)
Waiting for the upward break of 1.536 resistance level, which will complete a bullish trend reversal pattern to go LONG. Only the downward break of 1.292 would cancel the bullish scenario.
Trade details
Entry: 1.536
Stop loss: 1.292
Take profit 1: 1.687
Take profit 2: 1.930
Score: 6
Strategy: Bullish reversal

$RUNE looking bullish Looking at the daily time frame on rune, we can already see that rune is almost breaking the trend line and same time crossing the 50EMA.
Seeking to take a long position at 1.480-1.484 areas to take profits at 1.626 and tight stop loss at 1.432- 1.430
Not financial advice
Follow me for more

Buy call #6 rune usdtBuy call #6
Rune usdt
Buy: 1.451
Sl: 1.416 (2.28%)
Tp1: 1.519 (4.83%), r/r: 2.12
Tp2: 1.589 (9.66%), r/r: 4.24

RUNE/USDT LONG SCALP SETUP! 25-30% PUMP EXPECTED!!Hello everyone, if you like the idea, do not forget to support it with a like and follow.
Welcome to this RUNE/USDT trade setup.
RUNE looks good here. Breaks out from the bull flag-like structure in 4hr time frame and currently retesting it. Also, holding well above the 200ema. Expecting a 25-30% pump from here. Long some here.
Target1:- $1,52
Target2:- $1.64
Target3:- $1.75
Target4:- $1.86
SL:- $1.40
Leverage:- 5x-10x
If you like this idea then do support it with like and follow.
Also, share your views in the comment section.
Thank You!

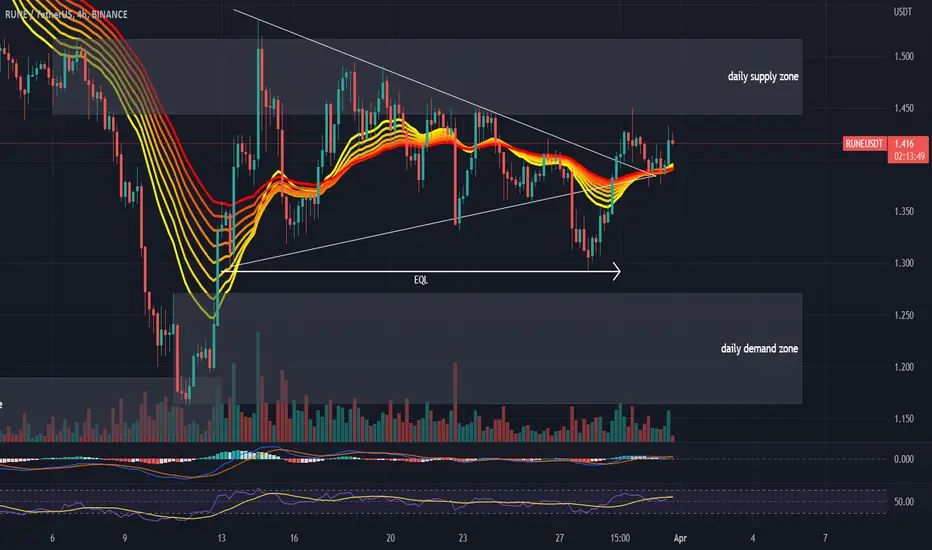
#RUNEUSDT 4H Chart
Price retested the daily supply zone where it got rejected from. MACD is not clear, RSI is bought and EMAs are neutral. I expect price to move down and liquidate the equal lows and tap into the daily demand around $1.25 before moving up again.
Rune/usdtim capitalizing on dips and pullbacks because the charts looks good and i think its a good investmentk,
you can follow me in insta : iawaisx

RUNEUSDT Is Making Bearish Flag Pattern.BINANCE:RUNEUSDT is making bearish Flag Pattern, Market has done CHOCH in Shorter timeframe, so there is a high chance of breakdown.
NO FINANCIAL ADVICE– The Information on this website, Crypto Current, is provided for educational, informational, and entertainment purposes only, without any express or implied warranty of any kind, including warranties of accuracy, completeness, or fitness for any particular purpose.

Ichimoku Analysis for RUNE$RUNE will short once we get a bounce till 1.522 on this. Also will make sure that lagging is below the kumo cloud. TP1 will be 1.3 and TP2 will be 1.162

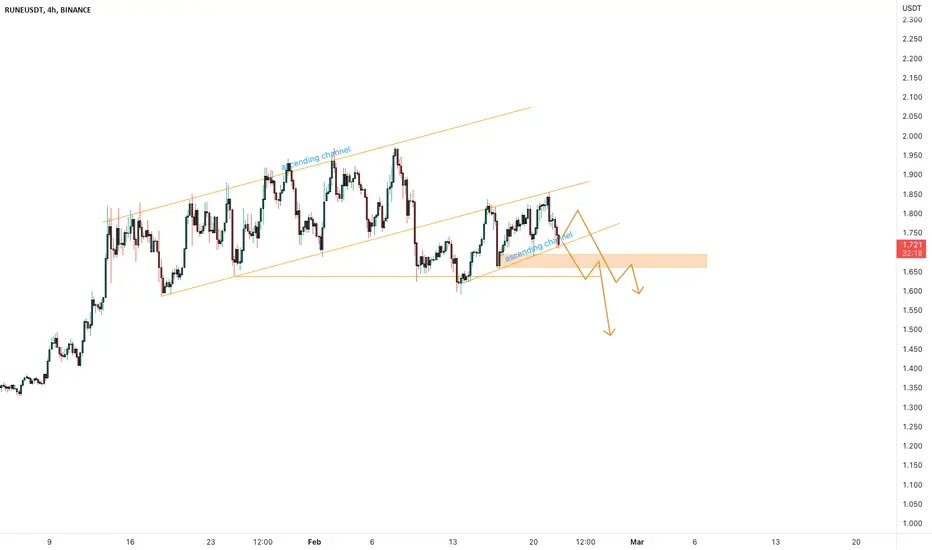
RUNEUSDT is creating another ascending minor channelRecently, the price of RUNEUSDT has experienced a breakout from its ascending channel , which is a technical analysis pattern that signals a bullish trend . This breakout occurred after the price was rejected at daily resistance, indicating that buyers were able to overcome selling pressure and push the price higher.
However, a new ascending minor channel is now forming, suggesting that the upward momentum may be losing steam. If the price of RUNEUSDT were to lose support, it would indicate a potential shift in market sentiment from bullish to bearish . In this scenario, traders may consider applying Plancton's Rules, a trading strategy that involves taking a short position when a market experiences a significant price drop.
–––––
Follow the Shrimp 🦐
Keep in mind.
🟣 Purple structure -> Monthly structure.
🔴 Red structure -> Weekly structure.
🔵 Blue structure -> Daily structure.
🟡 Yellow structure -> 4h structure.
⚫️ Black structure -> <= 1h structure.
Follow the Shrimp 🦐
Rune buying level!Rune is at support.we can buy some here and keep some money for DCA if It went below this support..but this is a good buying level.


$RUNE/#USDT [#THORChain]: Resistance_Breakout_Confirmation◳◱ A Resistance Breakout and Confirmation has been detected on the $RUNE / $USDT chart. The price has broken above a key resistance level and has been confirmed by a strong candle, indicating a potential bullish trend. The next resistance key levels are located at 1.819 | 1.986 | 2.285, and the major support zones can be found at 1.52 | 1.388 | 1.089. Consider entering a trade at the current price zone of 1.635 and targeting higher levels.
◰◲ General info :
▣ Name: THORChain
▣ Rank: N/A
▣ Category/Sector: N/A
▣ Overview: THORChain project overview is currently unavailable. I'll try to update this in the upcoming analysis.
◰◲ Technical Metrics :
▣ Mrkt Price: 1.635 ₮
▣ 24HVol: 9,347,576.790 ₮
▣ 24H Chng: -0.729%
▣ 7-Days Chng: N/A
▣ 1-Month Chng: N/A
▣ 3-Months Chng: N/A
◲◰ Pivot Points - Levels :
◥ Resistance: 1.819 | 1.986 | 2.285
◢ Support: 1.52 | 1.388 | 1.089
◱◳ Indicators recommendation :
▣ Oscillators: NEUTRAL
▣ Moving Averages: STRONG_SELL
◰◲ Technical Indicators Summary : SELL
◲◰ Sharpe Ratios :
▣ Last 30D: N/A
▣ Last 90D: N/A
▣ Last 1-Y: N/A
▣ Last 3-Y: N/A
◲◰ Volatility :
▣ Last 30D: N/A
▣ Last 90D: N/A
▣ Last 1-Y: N/A
▣ Last 3-Y: N/A
◳◰ Market Sentiment Index :
▣ News sentiment score is N/A
▣ Twitter sentiment score is 0.70 - Bullish
▣ Reddit sentiment score is 0.38 - Bearish
▣ In-depth RUNEUSDT technical analysis on Tradingview TA page
▣ What do you think of this analysis? Share your insights and let's discuss in the comments below. Your like, follow and support would be greatly appreciated!
◲ Disclaimer
Please note that the information and publications provided are for informational purposes only and should not be construed as financial, investment, trading, or any other type of advice or recommendation. We encourage you to conduct your own research and consult with a qualified professional before making any financial decisions. The use of the information provided is solely at your own risk.
▣ Welcome to the home of charting big: TradingView
Benefit from a ton of financial analysis features, instruments and data. Have a look around, and if you do choose to go with an upgraded plan, you'll get up to $30.
Discover it here - affiliate link -
RUNEUSDTThis signal was issued in a situation where this coin has completed its classic head and shoulders pattern and is breaking the neck line, and also broke its daily trend line and Welbeck has done it.

#RUNEUSDT 6H Chart
Price is consolidating between the resistance at $1.65 and the 4h demand zone around $1.55. MACD turned bullish, RSI is sold and EMAs are bearish. I expect price to move up from here aiming towards the $1.7 area where we have a minor supply zone. Waiting for confirmation.

