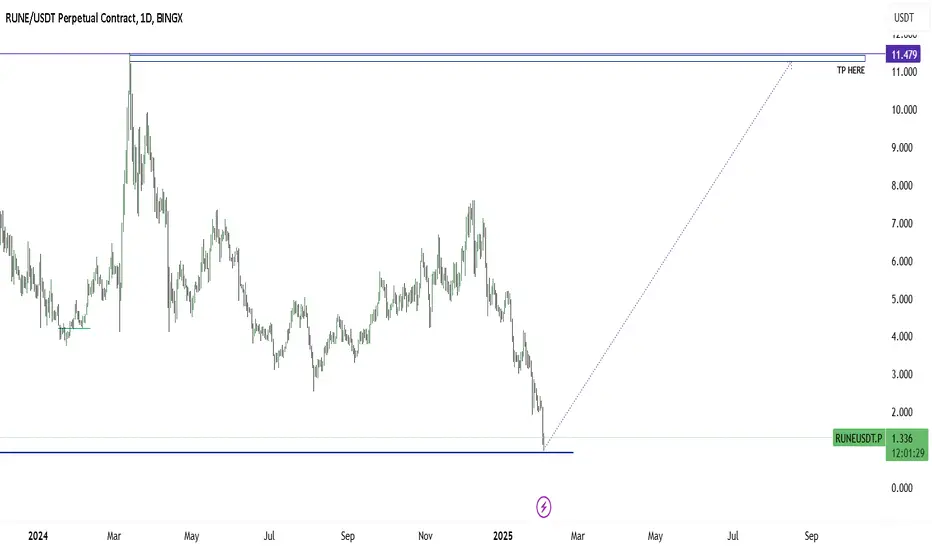
Rune for Long I wasn't expecting to see Rune's chart today. I was looking at the 1-hour timeframe but didn't find a good trade entry. However, when I checked the daily timeframe, I saw potential. Maybe I'll keep an eye on this since it's already moving within its zone. As long as it doesn't break 0.792, I'll look for a long position.
By the way, check the volume on a higher timeframe—thank me later! 🚀
RUNEUSDT trade ideas
Will RUNE collapse like LUNA?Well bad news for rune, good news for all shorters, Collapse if non likely as of now, but i hope you dont collapse catching a falling knife

$RUNE to $60Simply programmed by the universe and its fractals inside
$60 is next major target for the thorCHADS
good luck and see you soon


$RUNE is crashing. What is the consequence for Defi?This idea focuses more on DeFi and Web3 as a whole rather than the specific case of $RUNE.
What is happening to CRYPTOCAP:RUNE can happen to any other DeFi protocol, so it’s crucial to analyze how these protocols work, identify the risks, and explore how to mitigate them.
### How DeFi Protocols Work
CRYPTOCAP:RUNE , like many other protocols, is powered by smart contracts. These are small programs that execute tasks like lending, swapping, and other DeFi functions automatically and without human intervention. Investors love these protocols for their decentralized nature and trustless execution, enabled by blockchain technology.
CRYPTOCAP:RUNE gained popularity because its decentralized protocol allowed its price to be tied to factors like its total value locked (TVL) and fee earnings. The more people staked, provided liquidity, or used its lending services, the more CRYPTOCAP:RUNE ’s price increased. For instance, we saw CRYPTOCAP:RUNE rise from $3 to $12 last year as people used the protocol to loan CRYPTOCAP:BTC and CRYPTOCAP:ETH during their price surges.
### The Mechanism Behind CRYPTOCAP:RUNE
DeFi protocols like CRYPTOCAP:RUNE rely on the token itself as collateral. For example:
- When users send CRYPTOCAP:BTC or CRYPTOCAP:ETH to the protocol, it automatically buys and sells CRYPTOCAP:RUNE , which drives its price up.
- Conversely, when users withdraw CRYPTOCAP:BTC or CRYPTOCAP:ETH , the protocol sells CRYPTOCAP:RUNE to repay those users, which puts downward pressure on its price.
This mechanism can create vulnerabilities, as we’ve seen with $RUNE.
### What Went Wrong?
While all altcoins were losing value, CRYPTOCAP:BTC outperformed to the point where the total value of CRYPTOCAP:BTC being staked and loaned on the protocol exceeded the total value of $RUNE. In simple terms, if everyone requested their CRYPTOCAP:BTC and CRYPTOCAP:ETH back, the protocol would not have enough CRYPTOCAP:RUNE to sell and repay them. This is known as **insolvency**.
Last year, when authorities paused Rune Swap for a week to investigate criminal activity, CRYPTOCAP:RUNE ’s price plummeted from $2.2 to $1.3 as smart contracts automatically compensated for reduced earnings and people redeemed their staked assets, forcing the protocol to sell $RUNE.
### The Catastrophic Validator Decision
This month, with the price of CRYPTOCAP:BTC surging, some inverstors decided to cash out from CRYPTOCAP:RUNE and that is when they realized that the price of CRYPTOCAP:RUNE was so underperforming CRYPTOCAP:BTC that the protocol might be insolvent. They createed a "bank run" and an avalanche of investors lost their trust and asked their coins back.
To prevent a complete collapse, validators—who are essential for running the blockchain—used a private key to manually stop the protocol. This halted the smart contracts from continuing to sell $RUNE. However, this move backfired.
Observers saw the protocol being manually interfered with, highlighting its insolvency and raising serious concerns. This decision led to even more fear, uncertainty, and doubt (FUD). It became clear that DeFi’s lack of flexibility and inability to adapt to emergencies can create destructive outcomes.
### Broader Implications for DeFi Protocols
This exposes a significant vulnerability in all DeFi protocols. Many rely on their own coin as collateral, but if CRYPTOCAP:BTC continues to rise in value and users decide to withdraw their CRYPTOCAP:BTC , the protocols could face the same insolvency issue. In some cases, the amount required to repay users may exceed the protocol’s total collateral—or even the market cap of the altcoin itself.
### The Potential Domino Effect
If platforms like Uniswap, PancakeSwap, Hyperliquid, and others fail to address this issue, we could see a domino effect:
- Investors may withdraw their funds from DeFi protocols, leading to a collapse of the entire DeFi ecosystem.
- Such an event would have dire consequences for the broader altcoin market.
### The Solution
If CRYPTOCAP:BTC continues its bull run alone, DeFi platforms may need to reconsider their reliance on CRYPTOCAP:BTC and stop lending/staking and swapping to $BTC. Failure to adapt could render many protocols insolvent, triggering unprecedented FUD and potentially causing the crypto market to crash.
### Conclusion
The current situation with CRYPTOCAP:RUNE is a cautionary tale for the entire DeFi industry. Without proactive measures, the very mechanisms that make DeFi appealing—decentralization and automation—could become its greatest weaknesses.

RUNE/USDT risky longAn analysis a potential upward movement with a target price of $2.45 and a stop-loss set at $1.70. This indicates a bullish outlook, anticipating a significant price increase. The stop-loss at $1.70 is a risk management measure to limit potential losses if the price declines, while the target at $2.45 reflects the anticipated profit level.
Please note that cryptocurrency markets are highly volatile, and past performance does not guarantee future results. It’s essential to conduct thorough research and consider your risk tolerance before making any investment decisions.

RUNE COIN PRICE ANALYSIS AND NEXT POSSIBLE MOVES!!CRYPTOCAP:RUNE Coin Updates!!
• From Last 4 weeks we are seing now massive draw down in CRYPTOCAP:RUNE Coin Price.
• in any condition its need to hold 1.70$-1.50$ weekly support area for pottential bounce back.
• Without SL Don't try to build trade on it ( because of recent fuds selling pressure is still high on it)
Warning : That's just my analysis DYOR Before taking any action🚨
RUNEWe see a half-and-half support at the daily midline
But in the short term, there is a small resistance at the red dots


Trading opportunity for RUNEUSDTBased on technical factors there is a Buy position in :
📊 RUNEUSDT
🔵 Buy Now or by Breakout
🪫Stop loss 1.850
🔋Target 2.820
📏 R/R 2.5
💸RISK : 1%
We hope it is profitable for you ❤️
Please support our activity with your likes👍 and comments📝

RUNEUSDTRUNE seemingly has a lot of ongoing issues, but it doesn't stop you trading (but with caution) I've drawn out this harmonic and also noticed a few imbalances in price. Boxed area is a potential reversal zone (which it's currently inside now) but there is an imbalance of price down at $1,62 area.....

RUNE potential macro 12Whoever has some knowledge in Elliott Wave theory knows that waves 3 are the monsters that need to be caught.
You can even see the circled iii size comparing to other two waves.
Having said that and knowing that Elliott wave is a fractal thing...
we could be potentially watching an opportunity of a life time
Wave 3 in Elliott Wave Theory is typically the strongest and longest wave in an impulsive structure. It represents a period of rapid price movement fueled by strong market sentiment and momentum. This wave often exhibits high volume and breaks key resistance levels, making it a favorite among traders. It cannot be the shortest of waves 1, 3, and 5, and is usually accompanied by widespread participation in the market.

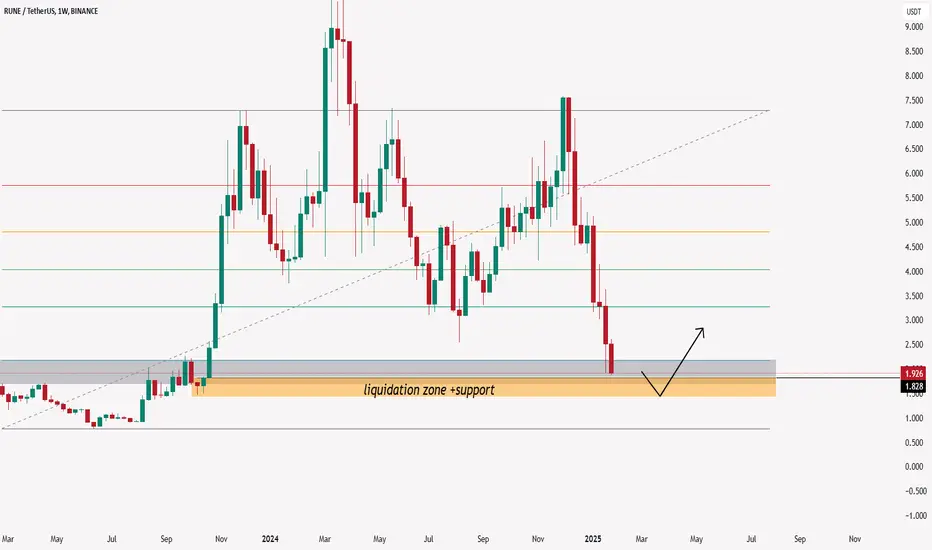
RUNEUSDTHi friends...
after a long time, we will open a new position....
in smaller time frames we have a liquidity zone in 1.8... because of losing the important support, we will have a drop... in about 1.8T we will buy some RUNE for targets around 5$
the price may have some correction in 4.5 then we will see higher prices....
good luck
hey, this is my own TA, so please do your research and do not trust me here!

RUNE/USDT AnalysisIf the price breaks out of the red resistance zone:
🎯 Targets:
1️⃣ First Target: Green line level
2️⃣ Second Target: Blue line level

RUNEUSDT LONGI think rune is forming a W- pattern..
we will long it as it reaches to our level..
Keep patience as its a key to success.
The setup is mentioned..in the chart


Prepare to BUY Spot RUNEUSDT (3M Cycle)🚀 Prepare to BUY Spot RUNEUSDT (3M Cycle)
🌟 The 3M cycle for RUNEUSDT shows signs of potential reversal – An early entry for high-reward opportunities! 🌟
🌍 Market Overview:
At the 3M timeframe, RUNEUSDT has not yet fully confirmed the necessary structures to validate a cycle bottom. However, gradual shifts observed from H4 to D1 suggest that the bottoming process might already be underway. This presents a favorable early accumulation opportunity.
📊 Trade Plan:
📌 Entry Point:
$2.2 - $2.4, or accumulate at lower levels if possible for optimal positioning.
🎯 Target:
Short-term: $6 - $7 – For immediate profit-taking opportunities.
Long-term: $14 - $20 – For substantial gains over the year.
⏳ Hold Time:
Throughout 2025, aligned with the expected 3M cycle development.
💡 Note:
Early entries carry additional risks but also offer higher rewards.
Monitor key structural confirmations and trends across timeframes to adapt your strategy.
Gradual accumulation and patience will be vital for maximizing returns.
🔥 RUNEUSDT is showing strong early signals – Seize the chance to buy into the next big move! 🔥

RUNE COIN PRICE ANALYSIS AND NEXT POSSIBLE MOVES AND TRADE SETUPCRYPTOCAP:RUNE Coin Updates!!
• Due to its recent fuds i am expecting now 15%-20% more drop in its price then maybe we see bounce back in its price.
Warning : That's just my analysis DYOR Before taking any action.

RUNERune always frontrun the bull cycle or the bearish one. Seems like we be having some trobule in next months. glhf

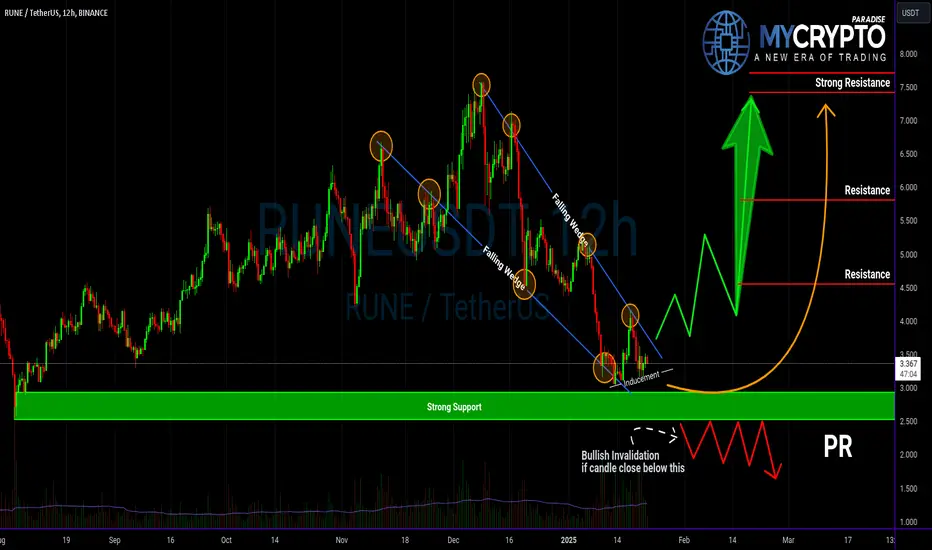
RUNEUSDT: Is This Falling Wedge About to Trigger a Major Move?Yello, Paradisers! Have you been keeping an eye on RUNEUSDT? The price is following a textbook falling wedge pattern—a bullish formation that’s caught our attention after a healthy retracement. But here’s the main question: Will this breakout bring the pump we’re all waiting for, or is more pain on the horizon? Let’s dive in.
💎If RUNEUSDT breaks out of the falling wedge, the probabilities for a bullish move will significantly increase. However, don’t jump the gun—confirmation is key! Look for big volume spikes accompanying the breakout to validate the move. Without sufficient volume, it’s just a fake-out waiting to trap impatient traders.
💎On the other hand, if we see more retracement or even panic selling, the price could dip below the current inducement levels. In this scenario, we’d expect a bounce from the strong support zone, which is sitting at a crucial level. To improve the odds in our favor, keep a close eye on bullish I-CHoCH (Internal Change of Character) forming on lower timeframes. This will provide an early signal for potential trend reversal.
💎Now, let’s address the flip side. If the price breaks down and closes below the strong support zone, it will completely invalidate our bullish idea. In such a case, the smart move is to exercise patience and wait for better price action to develop. There’s no need to rush when the market isn’t showing clear opportunities!
🎖 As always, Paradisers, discipline is your greatest trading edge. Don’t act on emotions or rush into trades without proper confirmation. Only the patient and strategic will profit in the long run. Stay focused, stay smart, and play this game like a pro!
MyCryptoParadise
iFeel the success🌴
Alikze »» RUNE | Head and shoulders pattern scenario🔍 Technical analysis: Head and shoulders pattern scenario
- According to the analysis presented in the previous post, he retested the supply area after exiting the congestion, but failed to break it.
- It is currently moving in an ascending channel in the weekly and daily time frames, which has broken the dynamic trigger.
- A head and shoulder pattern has formed in the weekly time frame.
💎 If after retesting the dynamic trigger fails to break it and breaks the neckline, it can confirm the head and shoulder pattern for a downward trend to the origin of the movement, which can have downward targets near 3.13 and 2.35 and a green box.
💎 Alternative scenario: if the dynamic trigger is broken, its first target will be $6.25 and then it can be offered after the pullback to the successful structure of breaking the zone, it can have the next targets of $9.38 and $12.5.
🛑 Resistance range: 6.25 - 9.38 - 12.5
🟩 Support range: 3.13 -2.35
»»»«««»»»«««»»»«««
Please support this idea with a LIKE and COMMENT if you find it useful and Click "Follow" on our profile if you'd like these trade ideas delivered straight to your email in the future.
Thanks for your continued support.
Best Regards,❤️
Alikze.
»»»«««»»»«««»»»«««

#rune daily levelI see a downward breakout, which can get a very strong reaction from the previous volume level, stop is put behind the lower boundary of the volume structure

THORChain Drops Nearly 30% Amidst 90-day Suspension of THORFiTHORChain ( CRYPTOCAP:RUNE ), a leading cross-chain liquidity protocol, has taken a severe hit, tumbling nearly 30% in 24 hours. This sharp decline follows the announcement of a 90-day suspension of THORFi lending services, igniting fears about the project’s financial stability. Let’s dive into the technical and fundamental aspects to understand the implications.
What Happened?
THORChain’s decision to pause THORFi lending services comes amid mounting financial uncertainties. Developers have initiated a 90-day restructuring plan aimed at stabilizing the platform. Key issues include:
1. Debt Overload:
- THORFi’s "Savers and Lending" programs accumulated significant unserviceable debt.
- Borrowings during lower BTC price levels created a shortfall, requiring the minting of CRYPTOCAP:RUNE to cover obligations.
2. Liquidity Concerns:
- Allegations of insolvency stem from insufficient Bitcoin reserves in lending pools.
- The lack of liquidation mechanisms worsened the financial strain.
3. Market Perception:
- Community members fear parallels with Terra/Luna’s infamous collapse in 2022.
- Synthetic assets backed by CRYPTOCAP:RUNE face increased scrutiny due to their reliance on liquidity pools for collateralization.
Despite these challenges, THORChain’s founder remains optimistic, stating that restructuring will allow the protocol to service its debt and restore stability.
Technical Outlook: What’s Next for CRYPTOCAP:RUNE ?
At the time of writing, CRYPTOCAP:RUNE is trading at $2.01, down 21% in the last 24 hours, with an RSI of 28.61, signaling oversold conditions.
Key Levels to Watch:
- Support: The 1-month low of $1.93 serves as critical support. A breach below this level could trigger a selling spree, pushing CRYPTOCAP:RUNE further down.
- Resistance: The nearest pivot point lies at the 38.2% Fibonacci retracement level, a potential target for recovery if market sentiment improves.
Trading Opportunities:
- Short-Term: Traders may capitalize on the oversold conditions for a potential bounce, especially as CRYPTOCAP:RUNE attempts to recover from the sharp decline.
- Long-Term: With the altcoin season expected in early March, analysts view this dip as an entry point for investors with a high-risk appetite.
Is This a Buying Opportunity?
While the current situation paints a grim picture, it also presents a window for traders to enter at discounted levels. The ongoing restructuring plan and the anticipated altcoin season could drive a recovery in CRYPTOCAP:RUNE ’s price.
However, caution is advised. The protocol’s financial health remains uncertain, and any further negative developments could exacerbate the decline.
Conclusion
THORChain’s current turmoil underscores the challenges faced by DeFi projects relying heavily on native tokens for collateralization. While the 90-day suspension of THORFi services aims to stabilize the platform, the road to recovery will depend on successful restructuring and improved market confidence.
For now, CRYPTOCAP:RUNE ’s oversold status and support at $1.93 offer short-term trading opportunities, but long-term investors should remain vigilant. The next few months will be critical in determining whether THORChain can emerge stronger or succumb to its financial woes.
