RUNE/USDT, shortStrong S/R being tested for the first time. I would be suprised if it pushed at once.
RUNEUSDT trade ideas

Mid-Term Bullish ScenarioTHORChain - Decentralized Liquidity Network Mid-Term Bullish Scenario !
If things go well for Alts, then this wave should be very profitable..
The gray zone is a solid resistance, once this level broke, it will fly.
(Chart is in Log Scale).
NFA/DYOR.


$RUNE close above 8 ema on the weekly with the macd about to cross this should pop quick
targets on chart invalidation red line
RUNEUSDT | LONG ABOVE BREAKOUTRUNEUSDT has been trading near the horizontal resistance. Previously price get rejected from same zone. We are expecting a bullish breakout above the resistance zone.
The bulls need to break the resistance zone and price must sustained above the key zone.
Manage your trades accordingly .

Double Top, ThorChain ( Rune usdt) - Shorted. 1 hour chart Runeusdt / 1 hour. price action taking support of trend line, breaking the trend line would confirm the down trend.
Trade with me
Entered $2.76
Stoploss @2.86
Take profit $2.58

RUNEUSDobv trend still bullish
volume coming in here is also bullish
if thats deviation of the falling wedge structure then a reclaim would see the potential for 189%isdh
volume profile would suggest this case

Rune can rise to 3.5Since the 18th of June at 1.5 zone, Rune has started to rise and reached a local high at 3.
A correction followed that transformed into a congesting consolidation and, in fact, a symmetrical triangle.
A break above the resistance of this triangle would give scope to further gains with a measured target at 3.5 which also coincides with horizontal resistance.
Also a buy trade for this coin would have more than 1:2 R:R

RUNE/Bullishhello everyone
For the next 3-4 weeks, I foresee an uptrend for Rune to make a strong bearish move to the $1 range after retesting the previous support area.


RUNE at lower level of upwards channelHas been consistently putting in higher highs and is currently at the bottom of the upwards channel its been following.
This could be a strong LONG entry, however there is a strong resistance level indicated by the box. This is where id be looking for entries based on how it reacts!

RUNE / USDT Rune coming back to retest 4H demand area to form a HH and keep holding bullish order flow minimum target will at Swing High

RUNE TAIf BTC Continues to go down and by any chance deeps below 16k, my worst case scenario for RUNE is around 0.813 and if that is the case then ill be picking up some cheap coins filling up my rune bag. But if we have seen the bottom its still fine because I am looking an 8 Dollar Rune if we continue to the upside.

Runeusdt 4hThis is not financial advice
If brake this support you see rune berish
If rune not brake this support you see rune 3.400

Rune/USDT Short 📉Previous important support and resistance zones:
***s1: 2.591
***s2: 2.663
*s3: 2.218
***r1: 2.798
Conditions for short:
1. Bearish pennant breakout
2.trendline breakout
3.momentum indicator trendline breakout
4.resistance from previous support ***s1 zone
6.Money flow index turned red from green
7.volatility has increased
8.di- is above the di+
9.adx line is above 20 level
Stoploss:
1.above the previous support zone of ***s1: 2.591
Take profit:
1.dynamic take profit or trailing stop loss/take profit
Exit point:
1.will be updated later in the comments box only if someone asks

RUNE, the uptrend is blocked.The following are machine translations:
In the 4-hour chart, the mid-to-long term is rising along the upward trend. It is currently blocked and pulled back near 3. It forms a double top structure at 3 and is viewed as a short-term decline.
The fast and slow line of the indicator macd is about to go down to the zero axis, which is a bearish trend. The RSI indicator fell below the neutral 50 and is in bearish territory.
Summary: Along the trend, it forms a double-top structure correction near 3, the indicator is bearish, short-term bearish, and sees near the rising trend line, if it effectively falls below the trend line, the market continues to decline. Stabilize and rebound near the trend line, go long, and it is expected to break through 3.


RUNE USDT BUY TAKE A LONG POSTIONS RUNEUSDT take a long postions
entry at this level
and stop loss and tp at d point if you agree my idea please comeent this


Possible bullish continuationPrice currently in a bullish trend in the 1h timeframe. A breakout from the descending trendline as shown in the chart could signify a possible upside move to the recent swing high.
#NFA

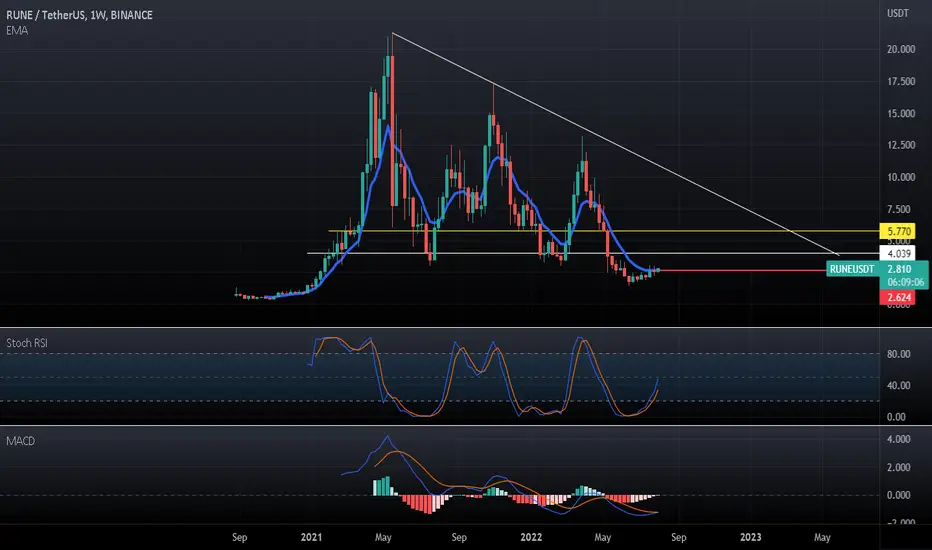
RUNE, Rejection or Break Out?RUNE is trading near strong former support which is now acting as a resistance.
Strong support/resistance static line with several hits (7 times ) is shown on the chart by thick red line. This static line supported the price for 5 times before breaking down. After break out , RUNE has found a new support and currently is at mentioned line again and may develop a valid pull back.
Rejection or break out? I myself, give more chance to rejection however, we have to be ready for every scenario.
Both rejection and break out targets are shown on the chart . We need a valid trigger to open a short/long positions at support/resistance zones. As always, we are trying to be unbiased.
Selecting right position , RUNE will brings us nice profit.
Good luck everybody.

RUNEUSDTthe market almost reach our buying zone after reaching target for previous selling zone with Impulsive sequence , we will wait till the zone reactivated again RR 3:1
