140% for RUNE?Buying right now with SL under weekly lows or under previous weekly candle lows... good R:R, quite RISKY trade...btc must stay stable or in the upside. Manage your risk
Not financial advice
RUNEUSDT trade ideas

RUNEUSDTHello Crypto Lovers,
Mars Signals team wishes you high profits.
This is a 4-hour-time frame analysis for RUNEUSDT
Here we have R2 which used to be a support area. R1 is our resistance line and you observe that the price was unable to rise. And S1 and S2 are the support areas which include the support of the price at some points. Now we have the price fluctuating over R1 and we believe it will rise to the height of R2 and then by a pull back to R1, it may start a rising trend again. Even it is possible for the price to lose the support at this area and face a decline to S1.
Warning: This is just a suggestion and we do not guarantee profits. We advise you to analyze the chart before opening any positions.
Wish you luck

$RUNE LONG IDEA good R:R$RUNE Long Trade Idea with good R:R possibility , good play for Spot positions, upside potential 100% - 200% , stop loss 20% , if your size is 1K USD for Example, you risk to lose 200$ , or you can win 1K$-2K$ if reaching TP's.

RUNE Daily_T Analyze>>>>>>>Hello EveryOne
I Have Tried My Best to Bring the best Possible outcome in this Chart.
In the case of broken down trend line in Daily-T frame, and completed pullback
We can entry long trade setup till 3.2-3.5 USDT>>>>>>>>>
Short term support & resistance's marked on the chart.
This is not financial advise.
PLZ DYOR
With hopping success>>>>

Will you be waiting??Rune is skyrocking today and here is my targeted. How long will it takes to get to the moon? Nobody knows but it will be there for sure one day .... long or short, will you wait and able to hold your position until then.....I guess I should bet on LUNC

RUNEUSDT | RISING WEDGERUNEUSDT is reaching to the top of the rising wedge. There can be two possible scenarios
1) Bullish Breakout
Long position can be taken if bulls managed to close above upper wedge
2) Bearish Rejection
While short position can be opened if a bearish candles formed near the upper wedge.
Trade your levels accordingly.

RUNEUSDTHello Crypto Lovers,
Mars Signals team wishes you high profits.
This is a 4-hour-time frame analysis for RUNEUSDT
Based on our previous analysis on July 13, we expected a rising trend and now we see that the price faced a rise. In this chart, there is R2 and R1 as our resistance lines and show the unsuccessful attempts of the price in order to rise . Also, we have S1, S2, and S3 as the support areas and they include the support of the price at some points since the past. At the present, we see the price fluctuating below R1 and we believe it will rise over this line and by having a fixation at that area, more rise is waiting for it to R2. If the price loses the support, it will fall toward S1 and even more.
Warning: This is just a suggestion and we do not guarantee profits. We advise you to analyze the chart before opening any positions.
Wish you luck

RUNE preparing for pumpIn recent days there there were increasing volume inflow into RUNE. It means whales are accumulating positions. Also there is triangle pattern. RUNE should pump if bitcoin price does not go negative

RUNEUSDT Cypher HarmonicThe information contained herein has been prepared for general information purposes only. The comments and recommendations contained herein are based on the personal opinions of commenters and recommenders. It should not be interpreted as a buy-sell recommendation or a promise of return on any investment instrument. These views may not be suitable for your financial situation and risk and return preferences. Therefore, making an investment decision based solely on the information contained herein may not yield results that meet your expectations.

Long Rune (Quick Scalp)# Quick Scalp Rune is ready to give 5%
Thursday, 14 July 2022 (GMT+5) 9:26 AM

RUNE/USDT IS REDY TO BOUNCE!!Hi guys, This is CryptoMojo, One of the most active trading view authors and fastest-growing communities.
Do consider following me for the latest updates and Long /Short calls on almost every exchange.
I post short mid and long-term trade setups too.
Let’s get to the chart!
I have tried my best to bring the best possible outcome in this chart, Do not consider it as financial advice.
Long RUNE/USDT
RUNE is making this ascending triangle pattern
Entry range:-$1.96 to $2
Target:- 50%
SL:- If any candle closes below the lower trendline of the triangle.
This chart is likely to help you in making better trade decisions if it did consider upvoting this chart.
Would also love to know your charts and views in the comment section.
Thank you

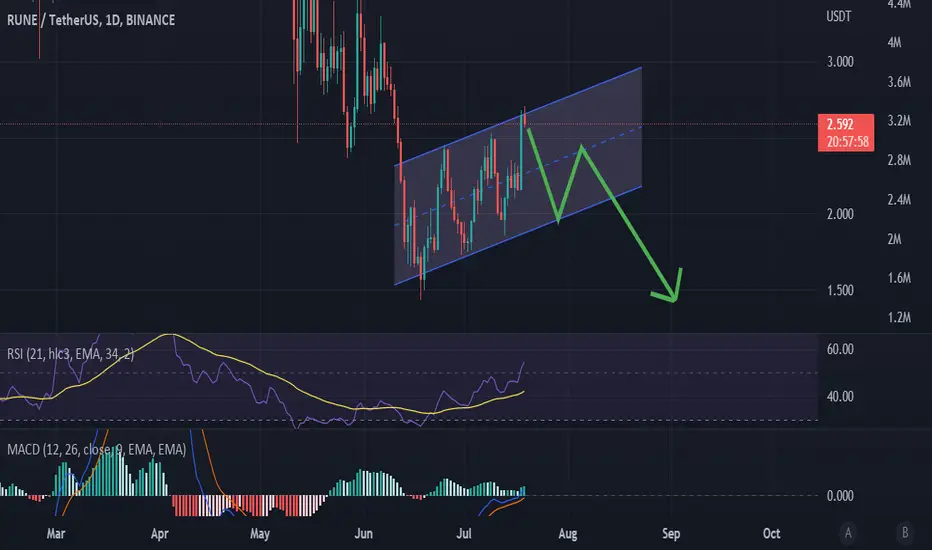
RUNE reacted strongly last week after hitting the resistanceHello to all members of TradingView and my followers.
RUNE reacted strongly last week after hitting the resistance of the $2.50 range. This resistance area, as it was identified as an important area on the chart last week, was faced with short-term buyers saving profits, and considering that the price was placed inside a triangle pattern and the overall market trend was also downward, the price The floor has broken the triangle pattern down. If we have a consolidation below the $2.20 range, we can expect the downward movement to continue until the bottom of the channel supports in the $1.5 and $1 range. For this week, RUNE's important support is drawn in the range of $1.67 to $1.56.
If it is helpful to you, please like it. If you have a comment, I'll be happy to know. Respectfully.

Runeusdt inverse head and shoulders....Our last bullish analysis on Rune was not triggered as we didn't get the strong 1H breakout candle we needed for entries....
Am proposing this riskier but more rewarding entry.
We will be needing an impulsive 1H breakout of that cute inverse head and shoulders for entries on the retest.
Like and subscribe......1:48R which goes to 1:5.5R on scale-in.

RUNEUSDTHello Crypto Lovers,
Mars Signals team wishes you high profits.
This is a 4-hour-time frame analysis for RUNEUSDT
Based on our last analysis on July 5, we predicted a rising trend and now you observe that the price had a great rise and one of our targets is hit. Here we have R1 as a resistance area and it expresses the disability of the price to rise. And S1, S2, ad S3 are our support areas which show the support of the price at several points since the past. At the moment, we see the price fluctuating on S1 and we believe it will rise to R1. Also, it will have a fall to S2 and then by a pull back to S1, it will face a decline again.
Warning: This is just a suggestion and we do not guarantee profits. We advise you to analyze the chart before opening any positions.
Wish you luck

RUNE long$RUNE is bouncing off the major bullish trendline. Rise to resistance level at 2,45$ is likely to happen.
