RUNE 4H SPOT - Holiday SeasonRUNE 4H SPOT but watch out it's holiday season in my country
.
Market Order Allowed
TP SL On Your Own
.
CP: 2.74
RUNEUSDT trade ideas

RUNEUSDT at a Crucial Level: What’s Next?
BINANCE:RUNEUSDT is trading at a critical support and resistance zone around the 3.269 level, a price point that has historically acted as a reaction area.
Bullish continuation:
Look for a break and close above the swing high at 4.141.
Price needs to maintain above the 3.269 level to confirm support.
Bearish scenario:
A close below 2.538 could trigger bearish momentum.
The 3.269 zone might flip into resistance.
This setup highlights the importance of these levels as the market decides its next move.
👨🏻💻💭 What’s your outlook for RUNE? Will it hold this key level or break down? Let me know your thoughts!
__________________________________________________________________
The information and publications within the 3Commas TradingView account are not meant to be and do not constitute financial, investment, trading, or other types of advice or recommendations supplied or endorsed by 3Commas and any of the parties acting on behalf of 3Commas, including its employees, contractors, ambassadors, etc.

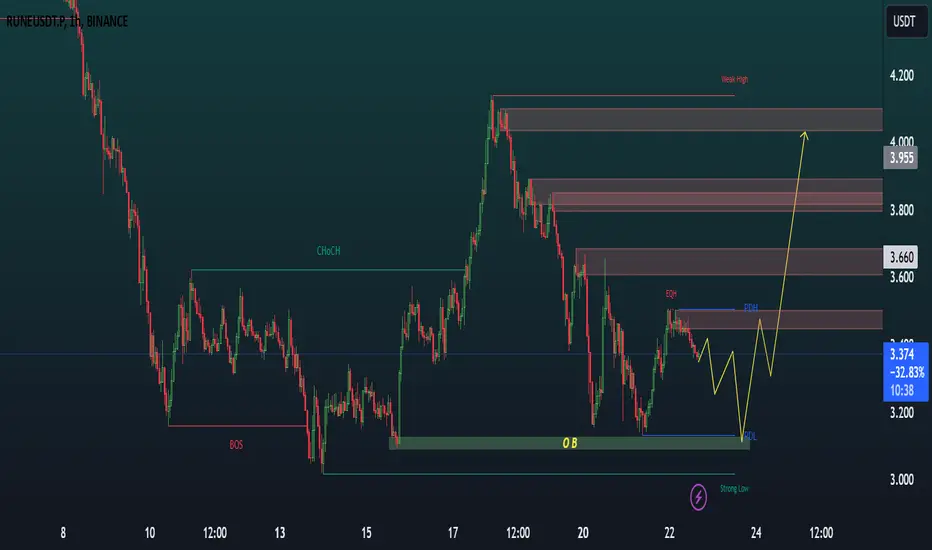
Rune bullish structure shift and ready for pumpRune did bullish CHoCH and now we are looking for long oppertunities, I have found ORDER BLOCK where I am planning to enter long. I have marked on the chart as well.
Rune/usdt"I expect growth from this range. You can take a buy position and enjoy the journey. Follow it step by"step until TP1 and TP2. Additionally, in the medium term, we will witness much higher targets."

RUNE 1h bearish trend breakRUNE seems to have broken out of the shorter term downtrend and could see some action to the upside. All eyes are on BTC of course. DYOR.

Golden Long Opportunity in RUNE | 600% Profit Potential!🔹 It looks like the Wave 2 correction for RUNE has ended, and we are now entering Wave 3. This is the perfect time to enter the market and capture massive gains!
🔸 Entry Price: $4
🔸 Stop Loss: $2.5
🔸 Take Profit: $28
💥 Risk-to-Reward: 1:16
📈 Profit Potential: Around 600%
📊 This analysis is based on Elliott Wave theory and key technical levels. With Wave 3 now underway, we expect a significant bullish move in RUNE’s price. Always use proper risk management and stick to your stop-loss!

RUNE bullrunRune looks super nice. I think we made a wave 1 and 2. Now going for that wave 3. Let me know what you think? I entered this one yesterday.

Skyrexio | Thorchain RUNE Is About To Explode!Hello, Skyrexians!
Recent month was difficult for cryptocurrencies, but BINANCE:RUNEUSDT was one the top losers. It was able to drop to almost the 2024 lowest price. Holders are scared, but Elliott waves power make us sure that this asset will explode significantly in 2025.
Let's take a look at weekly time frame. Previous bull run was huge and impulsive. The bear market did not overlap the bottom, it means that now price is in global wave 3. Recent dump is just the correction which reached the 0.5 Fibonacci level. We have already seen the green dot on the Bullish/Bearish Reversal Bar Indicator inside this zone. Now price is about to print another one. As always, alerts from this indicator are automatically replicated on my accounts. You can find the information in our article on TradingView . If this analysis is right, now price is about to show the most significant growth to $35-50.
Best regards,
Skyrexio Team
___________________________________________________________
Please, boost this article and subscribe our page if you like analysis!

$RUNE is in my buying zoneCRYPTOCAP:RUNE has once again re-entered my buying zone, which I believe presents a buying opportunity.
The team is rolling out their next update, causing a temporary slowdown. As you know, CRYPTOCAP:RUNE 's price is closely tied to the number and volume of transactions on the network.
Since the new version hasn’t been fully deployed across all nodes yet, it’s impacting both the volume and the price. Once the update is complete, CRYPTOCAP:RUNE should recover.
DYOR, of course. Keep in mind that if BTC crashes, all altcoins will likely crash too, regardless of their fundamentals.

RUNE Nice buy opportunityRUNE is trying to reverse in a very important zone. A reclaim above 3.85 will be a strong confirmation of a possible bounce. I am buying and accumulating targeting the resistance area at 6.0

Run/usdt is ready for short positionThis is what I see on the chart!
you can get a trigger to entry in 5 minutes
Donation: (TRC20)
TDN6pUjtkCKKVRoXZH2SYhS4k1jvjzjZFS

TradeCityPro | RUNE: Navigating Key Levels and Momentum Insights👋 Welcome to TradeCity Pro! In this analysis, I want to examine the RUNE coin for you. This coin is the official project token of Thorchain and is active in the DeFi and Cosmos ecosystem.
📅 Weekly Timeframe: Hidden Trendline
In the weekly timeframe, we observe a hidden trendline that has formed from the ATH, and now, during its bullish trend corrections, the price is reacting to this trendline.
🔍 After the price reached a low of $0.817, as you can see, the buying volume significantly increased, and the price moved up to the area of $7.391, forming a range box between this area and $3.028. The ceiling at $7.391 had a fake breakout once, and in recent weeks, the price has been rejected from the $7.391 ceiling again.
✨ Currently, the price has touched the support at $3.028 again. If this area breaks, a double top could be activated with a target of $1.269. If the RSI breaks below 35.82, the likelihood of this scenario will increase.
🔽 If there is further correction and the $3.028 support breaks, the first important area would be the hidden trendline, and the next areas in order would be $2.037, $1.269, and $1.817. There are other areas in between, but these are the strongest levels on this chart.
🛒 For buying in spot or long-term long positions, the first trigger is breaking $7.391, which seems like a very suitable trigger. If this area is broken, the price could potentially move at least to its ATH, which is $19.816. If the ATH is broken, I will update the analysis to find the next targets.
📝 Final Thoughts
This analysis reflects our opinions and is not financial advice.
Share your thoughts in the comments, and don’t forget to share this analysis with your friends! ❤️

RUNEUSDT 1WRUNE ~ 1W
#RUNE If you still have Conviction on this coin,. This support block would be a very good buying place for now,. Minimum Target 20%++

RUNE SWING LONG IDEA| Daily Completion of Harmonic Pattern , let's wait for a good bounce within the PRZ.

$RUNE possible bottom?I see the possibility to buy #RUNE right now, after this big dip it is confirming a path.
No financial advise but I'm opening a long position from here with stop loss at 10%.


RUNE Long Opportunity Market Context:
RUNE is showing signs of strength after consolidating near support and reclaiming the 200-day EMA, with a higher low further reinforcing the bullish structure. Holding above key trendlines, the setup indicates a potential continuation to the upside.
Trade Details:
Entry Zone: $4.30 – $4.70
Take Profit Targets:
TP1: $6
TP2: $8
TP3: $13
Stop Loss: Daily close below $4
This setup offers an opportunity to position for a potential breakout while managing risk effectively. 📈

Trading opportunity for RUNEUSDTBased on technical factors there is a Buy position in :
📊 RUNEUSDT
🔵 Buy Now
🪫Stop loss 4.990
🔋Target 5.550
📏 R/R 2
💸RISK : 1%
We hope it is profitable for you ❤️
Please support our activity with your likes👍 and comments📝

#RUNE #RUNEUSDT #THORChain #Analysis #Eddy#RUNE #RUNEUSDT #THORChain #Analysis #Eddy
At your request, dear followers, I'm here with a technical analysis of THORChain (RUNE).
On the daily timeframe, after exiting the trend and the ascending channel, I expect RUNE to have a Sharpe decline to the specified demand area after pullback to the specified supply zone at 5.170 & 5.270.
After this drop to the demand zone, with confirmation, we can enter long positions with a focus on the targets of $10 and $20.
It is also appropriate for spot buy in prices : 2.150 & 2.000
I also invite you to benefit from my Bitcoin analysis...
Bitcoin analysis: ((BTC/USD)): Check the link:

RUNE may pump soonhi traders,
Altcoins shows signs of strength
RUNE may recover soon.
The idea is based on the fib levels.
Enter long position now or wait for a small pullback on lower timeframes.
Target: 6,30
Stop loss: 4,29
Risk-reward ratio: 2,92

A New Map; A New Market; Sustained Growth & MoreSometimes reading a chart is just easy. THORChain here, RUNEUSDT. Notice the volume on the previous bull-market. Notice the flat period between 2021 and late 2024. The significant increase in trading volume indicates we are now entering a new bull-market phase. A long-term higher low, August 2024 vs June 2023; indicates a long-term higher high. 2025 vs 2021.
RUNEUSDT can reach $34 or beyond $40 late this year. You can do the maths for the potential such a price would entail. Just divide the projected ATH target vs the current price. That's more than 600% if $34. Might go much higher.
If you notice the initial bullish wave in late 2024, it is less steep than in the past. We also know that 2021 was an anomaly due to Covid and extreme monetary expansion. See how steep the rise was back then. This time, there is more support. The rise is healthier, the rise has been steady. This gives strength to the pair (market). This means that the bull-market can definitely be something different to what we experienced in 2021. We cannot compared to 2017 because the conditions were so much different. Cryptocurrency is young. It is very possible that we will have a new map and many projects would produce their own cycles. They will detach from the exchange generated bot trading charts. With real humans buying and selling, we are bound to see new charts and varied dynamics across the market. Instead of everything being the same; everything will be great.
Namaste.

RUNEUSDT second cycle about starting The bull phase for RUNEUSDT is about starting any time soon. As the first bigger wave 1 is completed around $10 the pull back wave 2 began and its expected to end around $2.5 which is unfolding in an ABC three wave structure. Bulls are expected to buy Rune around the demand zone and hold for 250 to 300 days max to unlock 2,245% price movement around $50.

Rune One week Trading IDEA
📍 Crypto SIGNAL #📍
COIN: $RUNE/USDT (3-5x)
Direction: LONG 📈
➖➖➖➖➖➖➖
➡️ Entry : 3.100 - 4.60
🔰 Targets
🎯 Short Term :
🎯 Target 1 - 5
🎯 Target 2 - 5.50
🎯 Target 3 - 6
🎯 Mid-Term :
🎯 Target 4 - 7.50
🎯 Target 5 - 9
🎯 Target 6 - 11
🎯 Long Term :
🎯 Target 7 - 14
🎯 Target 8 - 16
🎯 Target 9 - 18
🎯 Moon Bag - 20+
❌ Invalid Level : 1 day candle close below 2.50
➖➖➖➖➖➖➖
#SRFXTEAM💻
