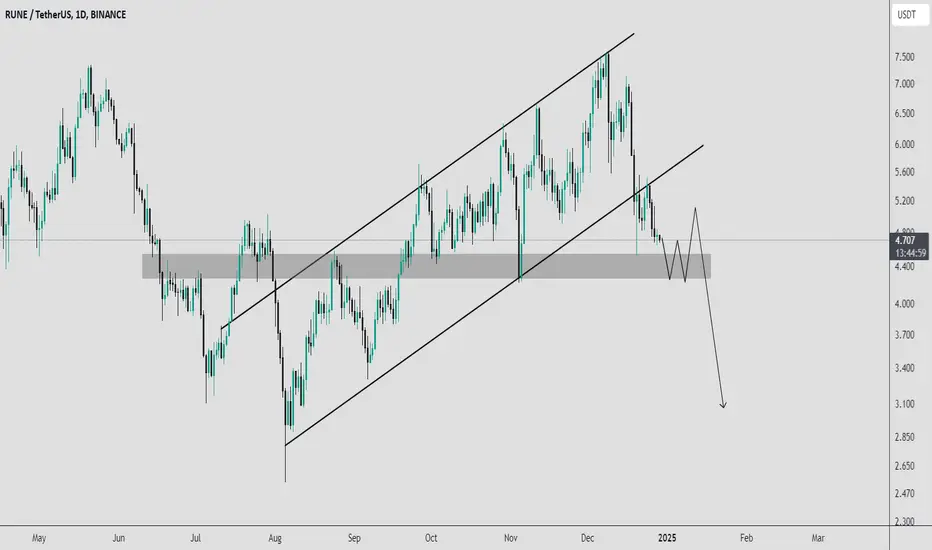
RUNE/USDT Testing Critical Support – What's Next?RUNE/USDT depicts a bearish breakdown from a rising channel pattern. The price is currently hovering near the critical support zone around $4.20 to $4.50.
If this key support fails to hold, we could see a continuation of the downward momentum, targeting levels near $3.50 or lower.
However, a temporary consolidation near the support zone cannot be ruled out before the next decisive move.
DYOR, NFA
RUNEUSDT trade ideas
RUNEUSDT: Bullish Trend RUNE is moving in uptrend and currently RUNE is touching the trend line and there is also bearish divergence on 1hr time frame, but as per my analysis, RUNE is dilute the divergence and its possibility to move in uptrend. so use proper risk management with SL and TP.

$RUNE is in an uptrend channelCRYPTOCAP:RUNE is an excellent DEFI blockchain that currently appears undervalued, taking time to recharge its momentum.
The price is trending upwards, with a short-term target of **$7**.
If you took advantage of the opportunity to accumulate in my **green box**, as outlined in a previous idea, you're well-positioned for solid profits. Stay patient and enjoy the ride! 🚀

RUNEUSDT: A Major Breakout or a Deeper Correction?Yello, Paradisers! Is RUNE about to explode or will it face a major rejection? Here's what you need to watch closely to avoid any costly mistakes.
💎Currently, RUNE is testing a critical resistance level at $7.7. A confirmed breakout above this zone will signal a bullish continuation, potentially opening the path for a mid-term rally towards our target major resistance area.
💎However, if RUNE faces rejection at $7.7, the price could pull back to the key demand area around $5.6. This level has acted as strong support before, and a successful bounce from here could reignite the bullish momentum.
💎But what happens if RUNE fails to hold at $5.6? Here's where caution is needed. Below the demand zone lies a key support trendline. If a breakdown occurs, this would trigger a bearish signal, increasing the probability of a move towards the next strong support area.
💎Looking back at RUNE's price history, the strong support area has been respected multiple times, making it a significant level to watch. Should RUNE retest this zone, there's potential for a rebound.
💎If RUNE closes a candle below $4.2, this would invalidate the bullish outlook. A breakdown here could lead to deeper losses, so stay cautious if price approaches this zone.
If you want to be consistently profitable, you need to be extremely patient and always wait only for the best, highest probability trading opportunities.
MyCryptoParadise
iFeel the success🌴

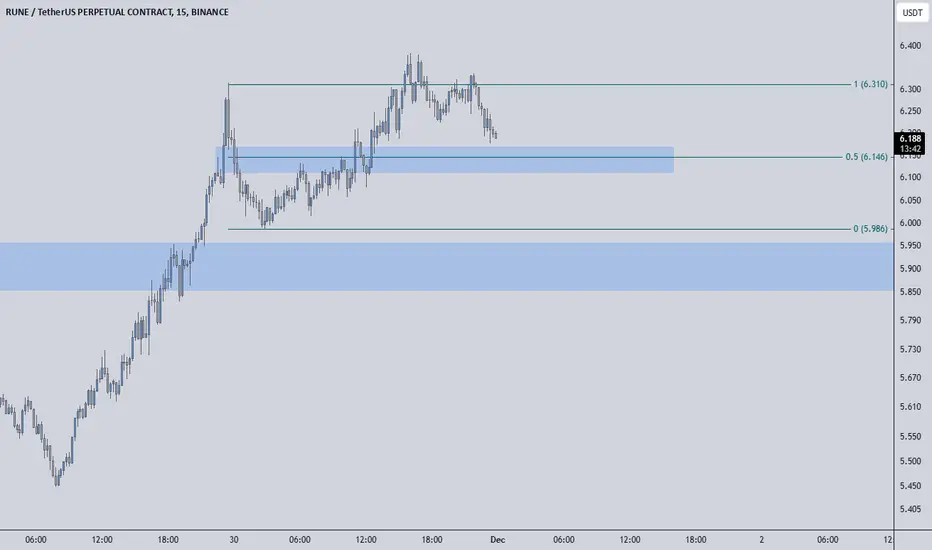
RUNEUSDT %151 VOLUME SPIKE BUT BE CAREFULRUNEUSDT: Volume Surge Without Buyer Confirmation
RUNEUSDT has recorded a 151% increase in volume, signaling heightened market activity. However, buyers have yet to step into the market decisively, which leaves the current movement uncertain.
📌 Key Strategy:
I will carefully monitor the price as it approaches the blue box zone. This area will act as a potential demand zone where reactions might occur. If upward breakouts emerge on the lower time frames, I will look to evaluate and confirm potential entry points.
🔑 Why This Matters:
Volume surges without immediate buying can indicate accumulation or pending reactions.
The blue box zone becomes crucial for observing buyer strength and momentum shifts.
Patience is key here. I will focus on stable breakouts and volume-supported moves to avoid false signals. Updates to follow as the price develops!
I keep my charts clean and simple because I believe clarity leads to better decisions.
My approach is built on years of experience and a solid track record. I don’t claim to know it all, but I’m confident in my ability to spot high-probability setups.
My Previous Analysis
🐶 DOGEUSDT.P: Next Move
🎨 RENDERUSDT.P: Opportunity of the Month
💎 ETHUSDT.P: Where to Retrace
🟢 BNBUSDT.P: Potential Surge
📊 BTC Dominance: Reaction Zone
🌊 WAVESUSDT.P: Demand Zone Potential
🟣 UNIUSDT.P: Long-Term Trade
🔵 XRPUSDT.P: Entry Zones
🔗 LINKUSDT.P: Follow The River
📈 BTCUSDT.P: Two Key Demand Zones
🟩 POLUSDT: Bullish Momentum
🌟 PENDLEUSDT.P: Where Opportunity Meets Precision
🔥 BTCUSDT.P: Liquidation of Highly Leveraged Longs
🌊 SOLUSDT.P: SOL's Dip - Your Opportunity
🐸 1000PEPEUSDT.P: Prime Bounce Zone Unlocked
🚀 ETHUSDT.P: Set to Explode - Don't Miss This Game Changer
🤖 IQUSDT: Smart Plan
⚡️ PONDUSDT: A Trade Not Taken Is Better Than a Losing One
💼 STMXUSDT: 2 Buying Areas
🐢 TURBOUSDT: Buy Zones and Buyer Presence
🌍 ICPUSDT.P: Massive Upside Potential | Check the Trade Update For Seeing Results
🟠 IDEXUSDT: Spot Buy Area | %26 Profit if You Trade with MSB
📌 USUALUSDT: Buyers Are Active

rune - triangleFormed a bullish triangle and marked the potential after the breakout on the chart. The first and main goal is $15, a small part can be left for growth to $40


SPOT RUNE LONG 16.12.2024Fixation after abnormal purchases.
🎯Purpose:
8.344
‼️Risk per trade: 0.5% of the allocated funds for spot trading.
Thank you for subscribing and responding🚀.

RUNEUSDT.1DThe daily chart of RUNE/USDT displays a fluctuating price movement within an ascending trend, approaching a significant resistance level. This analysis will explore the current price dynamics, key support and resistance levels, and implications of the technical indicators to forecast potential future movements.
Price Action and Structure:
RUNE/USDT is currently in an uptrend, as indicated by the ascending support line. The price has recently experienced a pullback and is trading around $5.716. This level is crucial as it sits near the trend line, suggesting potential for a bounce if the support holds.
Resistance and Support Levels:
Resistance Levels: The immediate resistance is at $7.336 (R1). Overcoming this level could open the path to retesting previous highs around $11.460.
Support Levels: Key support is established at $3.332 (S2). Before reaching this, the dynamic trendline and the price area around $5.716 (S1) will serve as initial support. Holding above these levels is vital for maintaining the bullish outlook.
Moving Averages:
The specific moving averages are not visible on the chart, but the price maintaining above the dynamic trendline suggests bullish sentiment in the midterm.
Technical Indicators:
MACD: The Moving Average Convergence Divergence (MACD) shows the signal line just above the MACD line but converging, indicating a potential reversal or slowdown in momentum. The histogram being near zero reinforces this potential pause in bullish momentum.
RSI: The Relative Strength Index (RSI) is at 60.55, which indicates moderate bullish momentum and suggests there is still room for upward movement before reaching overbought conditions.
Conclusion:
RUNE/USDT is exhibiting signs of a sustained bullish trend with the price testing the ascending trendline. The critical levels to watch are the support at $5.716 (S1) and resistance at $7.336 (R1). A break above R1 could signal further bullish momentum towards higher prices, while a failure to hold S1 might see the price heading towards $3.332 (S2). The MACD and RSI indicate a cautious outlook in the short term, suggesting that traders should watch for either confirmation of trend continuation or signs of a potential reversal.

RUNE tps for this bullbased on past bulls experience I believe fibs and cyclical highs and lows are the best levels to set for profit taking. yes, I do believe in decentralisation and crypto - its utility and potential but I will not bag hold, thinking ahead of time for the next bear/shopping market
taking also in consideration my spot avg entry and bag size, these are my tp levels and respective bag %s for $BINANCE:RUNEUSDT. once i get sls/trailling stops I will update the chart, too soon to plan for those
do as you please with it 🤝

RUNEUSDT 1WRUNE ~ 1W
#RUNE Buy gradually after breaking through this resistance line. with a minimum target of 20%+. The break of this resistance line confirms further bullish

Future Outlook for RUNEUSDT Based on Price Action Analysis
"After thoroughly analyzing the price action of RUNEUSDT, I believe that it is unlikely for the price to break above the level of 11.564. Based on the observed behavior, the current price movement suggests that this level will act as a strong resistance, and further upward momentum appears limited at this point."

$RUNE SHORT SIGNAL base on usdt.d and btc.d - rune in best place to trade in short position . all targets in the image & and you have to manage your risk and take min 5X - max 15X lev . dont forget capital managment .

TradeCityPro | RUNEUSDT The Best Opportunity of the Week👋 Welcome to TradeCityPro Channel!
Let’s analyze another cryptocurrency in detail, as the market is relatively calm right now, providing the perfect time to review and align our triggers.
🌍 Market Overview
As always, let’s start with Bitcoin. Over the past two days, Bitcoin hasn’t shown any significant movements, mostly ranging due to the weekend—something quite normal. These consolidations were needed for the upcoming moves.
For the week ahead, if Bitcoin breaks the 100,400 resistance and its dominance declines, make sure to focus on altcoins for potential positions or purchases. Conversely, if Bitcoin dominance rises, consider trading Bitcoin or coins paired with Bitcoin that are showing bullish trends.
🕒 Weekly Time Frame
RUNE is one of the coins that has shown some movement before the broader market moves began. It hasn’t risen from its all-time low but instead from its 2024 bottom, maintaining a bullish trend behind it.
You can consider buying after the weekly candle closes above 6.950, as this would indicate a breakout of weekly resistance. The volume is favorable, and the RSI has entered overbought territory. Place a stop-loss at 3.038 to participate in the potential move.
After initiating its move and finding support at 3.038, you can draw a Fibonacci retracement. The 0.382 level aligns with this support, and upon breaking the high (currently in progress), the Fibonacci extension levels suggest targets of 11.64, 26.431, and 46.375.
Some might wonder why the March 2024 movement wasn’t used for Fibonacci. This is because that movement was overly impulsive and later rejected, with a pullback to the previously established resistance at 6.95. Hence, this range is more appropriate for analysis.
📊 Daily Time Frame
RUNE is currently encountering a critical daily resistance. A breakout could lead to a move toward 10.695.
For a purchase in this timeframe, you can consider entering after a breakout above 7.32 with a stop-loss around 4.92. This would be a slightly riskier entry. Confirmation could come from an RSI pullback to 70 and a subsequent upward movement.
RUNE hasn’t shown much activity recently, but money appears to be flowing into it. Considering the weekly uptrend, it’s worth positioning ahead of a potential move.
🕒 4-Hour Time Frame
On the 4-hour chart, RUNE is following a parabolic curve and has reached the 7.352 resistance. After being rejected initially, it didn’t drop significantly, and on the next attempt, volume increased as it approached the high again. This second rejection further validates the resistance.
📈 Long Position Trigger
the trigger is clear enter after breaking 7.352. Use a wide stop-loss as this is a daily resistance breakout and may experience fluctuations; missing the move is not an option.
📉 Short Position Trigger
I’m still not interested, just as I’ve been in recent days. I prefer either resting or providing analyses for the community so we can collectively reduce stop-loss hits while building a stronger TradingView presence.
💡 BTC Pair Insight
RUNE, compared to Bitcoin, is in a favorable position. Unlike many altcoins, it’s not at its absolute bottom but rather near its 2024 low. Confirmation of an upward trend would come from breaking the weekly trendline or surpassing 0.00008139, which would likely initiate a significant pump. This relative strength compared to Bitcoin is a positive point for us.
📝 Final Thoughts
Stay calm, trade wisely, and let's capture the market's best opportunities!
This analysis reflects our opinions and is not financial advice.
Share your thoughts in the comments, and don’t forget to share this analysis with your friends! ❤️

RUNE/USDT Weekly Analysis$RUNE/USDT Weekly Analysis
#RUNE has broken out of a long-term descending trendline, signaling a shift toward bullish momentum. The current price is $7.365, reflecting a 21.43% increase, and the breakout has established a new support zone around $5.766, providing a solid foundation for further growth.
Key upside targets are identified at $10.077, $12.498, and $14.786. A potential pullback to the support zone at $5.766 could present an ideal buying opportunity before the next leg up.

If that happen RUNE could rise up (+175%) to (+230%)Rune is trying to break a huge symmetrical triangle pattern alongside with its price above of value area high from 2024 and anchored vwap from 2021 highs, is looking very strong and if it can close the weekly candle above $7,347 would suggest an increase up to the last bull run highs. The target is in confluency with the symmetrical triangle pattern, between 2021 highs and fibonacci extension levels.
TARGET: $19,82 TO $23,90 up to (+230%)

Last Chance: $RUNE Poised for Parabolic Move Beyond ATHsThis could be the last chance to enter before CRYPTOCAP:RUNE begins its parabolic move, or at least starts expanding, leaving everyone behind.
The new weekly trend is about to confirm, and it’s at a pivotal area. If it breaks above $7, this will trigger an even bigger upside. I believe CRYPTOCAP:RUNE is on track to break beyond its all-time highs and could potentially reach the second target near $75. It may seem ambitious, but the chart is signaling a strong move ahead. BINANCE:RUNEUSDT
Buying as close as possible to $6.60 for this setup.
Previous entries are posted here

Unbelievable Opportunity on RUNEUSDT💎 These Blue Boxes Aren’t Just Zones—They’re GOLDMINES! 💎
The blue boxes on this chart mark key areas of potential buying interest for RUNUSDT.P, carefully identified through my technical analysis. These zones represent areas where demand might step in, creating opportunities for a bounce or upward move.
While I remain humble, I’m confident in my ability to analyze the markets effectively. My previous analyses have consistently proven accurate, and I trust this setup will further validate my approach. Let’s see how the price action respects these levels, proof is always in the results.
📈 See It, Believe It, Trade It. 📉
Don’t miss out proof is in the results. Let’s make this count! 👊
My Previous Hits
🐶 DOGEUSDT.P | 4 Reward for 1 Risk (or more if you’re bold).
DOGEUSDT.P: Next Move
🎨 RENDERUSDT.P | HTF Sniper Precision
RENDERUSDT.P: Opportunity of the Month
💎 ETHUSDT.P | Buyer Zone So Accurate You’ll Double Check
ETHUSDT.P: Where to Retrace
🟢 BNBUSDT.P | Buyer Zone Mastery (CZ vibes).
BNBUSDT.P: Potential Surge
📊 Bitcoin Dominance | Called it Like a Pro
BTC Dominance: Reaction Zone
🌊 WAVESUSDT.P | The Blue Box: A Demand Zone with Potential
WAVESUSDT.P: Demand Zone Potential
🟣 UNIUSDT.P | Long-Term Trade
UNIUSDT.P: Long-Term Trade
Now sit back, relax, and watch the market do its thing. Or don’t, FOMO is real. 😉
Thorchain ( Rune )THOR Chain
RUNE usdt Daily analysis
Time frame daily
Risk rewards ratio >3.5
Target 6.8 $

RUNE Analysis: Ready for a Historic Surge?✨🚀 RUNE Analysis: Ready for a Historic Surge? 🚀✨
After a deep correction, RUNE is now entering a phase many analysts consider the beginning of its major upward movement. This cryptocurrency, which previously saw an incredible 65x growth from September 2020 to May 2021, is now poised to break new all-time highs.
🔍 Recent History:
June 2023: Formed a historical low at $0.77
March 2024: Reached $11
August 2024: Corrected to $2.5
RUNE is now at a key resistance level. If it breaks $7.5, it’s expected to reach the following targets:
🎯 Target 1: $30 (300% profit)
🎯 Target 2: $130 (1600% profit)
🔥 RUNE is ready to explode; don’t miss this opportunity! 💎


RuneUSDT Long IdeaIf Rune closes this 4hr wick above the 50ema, It's a great place to take a long and target the 50% of the weekly wick at $10.22 or weekly high at 11.6. Invalidation is 4%.

Rune Cup and handleRune has been forming a giant cup and handle which is a very bullish pattern the neckline is around 11.40 and if it confirms this pattern we can see a price target of between 18-24 in the coming weeks to months.
