Alts with UPSIDE POTENTIAL | ALTCOINS | RUNE, ATOM, FETIn this time of the cycle, many alts have already rallied... and a few, haven't, patiently awaiting their turn for some liquidity.
In this video, I take a look at my TOP picks - there are many more, but let's start with these.
1) FET
2) RUNE
3) ATOM
________________________
BINANCE:ATOMUSDT BINANCE:RUNEUSDT BINANCE:FETUSDT
RUNEUSDT trade ideas


RUNE looks greatI'm looking for coins that I can potentially rotate into in the near future. Here is one on my radar. I wouldn't jump in now. After it breaks 7.2, RUNE will be even more interesting. I'd say you should add to watchlist.

$RUNE to $7.7Looks like RUNE have made local bottom.
It jut need to get above $5.73 and it will teleport to it's target.
Have BTC in mind, if it dumb then whole market might follow.

Technical Analysis of the Cuphead patternThe current setup presents a classic cup-and-handle pattern, visually resembling the shape of a " Cuphead " character. This structure typically indicates a bullish continuation, as it forms after a period of consolidation within a broader uptrend.
Cup Formation:
Left Side of Cup: The pattern began after a pullback from recent highs, creating the initial drop and rounding bottom, representing the "body" of the cup (or "Cuphead's" round head).
Base of Cup: The support level at the bottom is significant, where volume likely decreased, indicating seller exhaustion and setting a strong foundation.
Right Side of Cup: Price begins to rise again, completing the rounded shape and signaling a renewed bullish sentiment as buyers regain control.
Handle Formation:
Handle Decline: The handle forms as a slight pullback from the right side of the cup, usually about one-third of the cup's height. It indicates a final consolidation before a breakout and serves as "Cuphead’s" handle.
Handle Length: The handle length should not exceed half the cup's height, as longer handles might signify weakening bullish momentum.
Volume Analysis: Look for decreasing volume during the handle formation, indicating weaker selling pressure, with an increase in volume as the breakout starts.
Breakout & Price Targeting:
Entry and Confirmation: A breakout above the handle’s resistance confirms entry into a long position, with a volume surge as buyers push the price upward.
Price Targets:
First Take Profit: At 100% profit, calculated based on the initial entry price and set to secure gains once the target is reached.
Second Take Profit at Cycle Highs: For further gains, the final target is set at cycle highs, leveraging the bullish momentum and trend continuation.
Risk Management:
Stop-Loss Placement: A conservative stop-loss can be set slightly below the handle’s low to protect against unexpected reversals while allowing some room for price fluctuations.
Trend Monitoring: Keep an eye on volume and candlestick patterns post-breakout to ensure continued bullish momentum, adjusting stops accordingly to lock in profits.

📈RUNE can go high to $40 level / Alt Season rally📉BINANCE:RUNEUSDT
KRAKEN:RUNEUSD
Hello Traders
Rune is one of my suggestions for the altcoin market.
You can clearly see that volume has increased continuously. ---> Highly potential for the alt rally season.
RUNE is the native token of the THORChain network. It represents a multi-purpose universal token that supports all functions on the THORChain network and helps run the protocol. RUNE is used in governance, for staking, bonding for validator Nodes, and trading.
The best strategy for altcoins is to allocate a certain percentage of assets (for example, 10% of the total portfolio) to buy potential altcoins.🎲

THORChain Aiming Lower 6X SHORT—369% PotentialThis is an updated version for our RUNEUSDT SHORT, the first one hit two targets with 4X and a total of 124% profits, the numbers are still good but you can follow this publication rather than the previous one.
Potential is much higher on this since we are using higher lev.
(This is not recommended for beginners; caution, high risk.)
➖ THORChain (RUNE) peaked in March 2024, it has been bearish since. We have the same chart patterns and price dynamics as the other Cryptocurrency kings and queens.
Is the correction over? We will soon know!
Those trading at bottom prices likely ended their correction already, those trading higher might have one final drop to go through before the correction is over; the last leg-down, the final market flush.
When the giants crash, money will flow from the big projects to the smaller ones.
The market is mixed, it is not easy to navigate.
Focus on one chart at the time and all is good.
See the full trade-numbers below:
____
➢ SHORT RUNEUSDT
Leverage: 6X
Entry levels:
1) $6.25
2) $5.75
3) $5.35
Targets:
1) $4.955
2) $4.555
3) $4.130
4) $3.763
5) $3.211
6) $2.831
7) $2.155
8) $1.951
Stop-loss:
Adjust to your own risk tolerance
Potential profits: 369%
Capital allocation: 3%
___
Remember to do your own research and planning before trading, this is not financial advice.
I am sharing my views and opinions of the chart.
The markets are unpredictable, that's what some people say. This doesn't matter, we can still use our brains to trade... The market can be predicted, the proof is in the charts.
Thank you for reading.
Namaste.

RUNEUSDT.P short-term forecast
Expectation of FVG filling, as well as volume voids after prolonged growth.
If a reversal formation appears and a retracement occurs, expect the upward movement to continue.

RUNE PROPER SWINGSimilarily to POPCAT, RUNE has nicely reclaimed all of its ema levels signaling a bullish trend. As well as forming a clear FVG on the 4h that matches with a fib level. I am heavily bullish on RUNE which explains why the TP is very high. This is however justified by the altseason coming up and after BTC dominance falls below the current trend I expect multiple alts including RUNE to run nicely.
OPEN TO CRITICISM AND NEW KNOWLEDGE
NFA

Trade Alert: RUNEUSDT Buy SignalAttention Traders,
We have identified a promising opportunity in the RUNEUSDT currency pair using the advanced EASY Quantum Ai strategy. Below are the details of the trade signal:
Direction: Buy
Enter Price: 4.624
Take Profit: 4.812
Stop Loss: 4.424
Rationale:
1. Market Momentum: The recent analysis shows a positive momentum shift in RUNEUSDT, as evidenced by bullish trends in technical indicators such as moving averages and MACD.
2. Support and Resistance Levels: The predicted rise is supported by a strong support level around 4.424, minimizing downside risks. The resistance at 4.812 aligns with profit-taking objectives, ensuring potential gains are maximized.
3. Volume Analysis: Increased trading volume highlights growing investor interest, further confirming the upward potential of this pair.
Our EASY Quantum Ai strategy indicates an upward trajectory, making this a favorable time to enter a buy position. Remember to closely monitor the market and adjust the trade as necessary based on evolving market conditions.
Happy Trading!

RUNEUSDTmy entry on this trade idea is taken from a point of interest BELOW an inducement.. I extended my stoploss area to cover for the whole swing as price can target the liquidity there before going as i anticipate.. just a trade idea, not financial advise

THORChain Aiming Lower 4X SHORT—246% PotentialWe are looking at both, bearish and bullish charts. The bearish ones are those that produced astonishing growth last year and into early 2024. The bullish ones are those that are trading at bottom prices or at new All-Time Lows.
➖ THORChain (RUNE) peaked in March 2024, it has been bearish since. We have the same chart patterns and price dynamics as the other Cryptocurrency kings and queens.
Is the correction over? We will soon know!
Those trading at bottom prices likely ended their correction already, those trading higher might have one final drop to go through before the correction is over; the last leg-down, the final market flush.
When the giants crash, money will flow from the big projects to the smaller ones. We already saw some of this yesterday and today. It is likely to intensify in the coming weeks. The market is mixed, it is not easy to navigate.
Focus on one chart at the time and all is good.
See the trade-numbers below:
➢ SHORT RUNEUSDT
Leverage: 4X
Entry levels:
1) $5.755
2) $5.250
3) $4.880
Targets:
1) $4.555
2) $4.130
3) $3.763
4) $3.211
5) $2.831
6) $2.155
7) $1.951
Stop-loss:
Adjust to your own risk tolerance
Potential profits: 246%
Capital allocation: 3%
___
Remember to do your own research and planning before trading, this is not financial advice.
I am sharing my views and opinions of the chart.
The markets are unpredictable, that's what some people say. This doesn't matter, we can still use our brains to trade... The market can be predicted, the proof is in the charts.
Thank you for reading.
Namaste.

RUNE to $14, falling wedgeOn the above chart price action has corrected over 70%. A long trade now presents itself, but that’s all. This is not a long term forecast by any means.
1) Price action breakout. (RSI remains in resistance).
2) Price action confirms support on past resistance.
3) The falling wedge top and lower touch points allow a near term forecast for price action, $14 area or 170% from current levels.
Is it possible price action corrects further? Sure.
Is it probable? No.
Ww

The Price About To Breakdown The Rising Wedge 👉 Clear Rising Wedge Formed At The RUNE Chart And Currently The Price Sitting Above The Main Trend Line And I Expect a Breakdown Toward a 4$ As a Next Stop

ADDITIONAL FOR MY BABY RUNEA daily and a past weekly open/close is aligned with the VAL of the range we just came back into.
No matter what anyone says, a reaction is imminent in this level.
It is a nice long with a hard tp on the weekly open, with the rest of the position left running as it is inline with the past idea posted on this account.
Entry and SL is as stated in the charts

2.4 RR - Strong IssueRune may bounce toward the upper lines from the 12 level it is currently hitting. If this is the case, this trade is no longer valid. Otherwise it may head down further toward the given entry. It still has room to run to the upside and making higher local highs is to be expected!

2 ALTCOINS in 2 MINUTES | AAVE & RUNE | Great UpsideTwo altcoins in under two minutes - each with a bright future and good-looking upside potential.
BINANCE:AAVEUSDT
AAVE might e heading back to retest a crucial support zone, in other words - you could get a cheaper entry. A good place to look for potential buy zones, is on the moving averages in the daily. The price is on the right-hand panel, and indicates possible bounce zones:
BINANCE:RUNEUSDT
RUNE is slightly more advanced in the bullish cycle, forming higher highs after retesting the key support. There is still a major upside potential. Ultimately, the earlier / lower you buy, the better (unless you are a swing trader or scalp trader).
Either way , many altcoins will begin to pick up now that BTC is trading sideways.
______________________________

RUNE ANALYSIS🔮 #RUNE Analysis
🌟🚀 As we sail earlier, #RUNE performed the same. Currently #RUNE is trading above its major support zone and we could see a retest before our next target
🔖 Current Price: $5.575
⏳ Target Price: $7.232
🏷Remember, the crypto market is dynamic in nature and changes rapidly, so always use stop loss and take proper knowledge before investments.
#RUNE #Cryptocurrency #DYOR

RUNEUSDTRUNEUSDT is in strong bullish trend.
As the market is consistently printing new HHs and HLs.
currently the market is retracing a bit after last HH, which is also the 50% Fib retracement level and local support as well. if the market successfully sustain this buying confluence the next leg up could go for new HH.
What you guys think of this idea?

$RUNEUSDT: Ready to Break Out! BINANCE:RUNEUSDT has recently broken out of its downtrend and is now forming a symmetrical triangle, signaling a potential breakout that could lead to a significant upward movement. The fundamentals behind CRYPTOCAP:RUNE are strong, supported by a dedicated community, which adds to its long-term potential. Traders should keep an eye on the breakout from the triangle, as this could ignite a major price surge. As always, remember to set a stop loss to manage risk effectively while taking advantage of this exciting opportunity.
BINANCE:RUNEUSDT Currently trading at $5.2
Buy level: Above $5.25
Stop loss: Below $4.38
TP1: $5.7
TP2: $7
TP3: $9
TP4: $11
Max Leverage 3x
Follow Our Tradingview Account for More Technical Analysis Updates, | Like, Share and Comment Your thoughts

RuneThe price has reached an important range in the ceiling.
With the formation of negative and volume divergence, the price can fall.
If Bitcoin goes up, this analysis will be ineffective

Important volume profile section: 5.163
Hello, traders.
If you "Follow", you can always get new information quickly.
Please click "Boost" as well.
Have a nice day today.
-------------------------------------
(BTC.D 1M chart)
I think that in order for the altcoin bull market to start, BTC dominance must fall below 55.01 and be maintained or continue to fall.
If BTC dominance rises above 62.47, I think that altcoins are likely to show a sharp decline or plunge.
Accordingly, I think that now is not the time to trade altcoins.
To trade altcoins, you need to respond quickly and briefly.
----------------------------------------
(RUNEUSDT.P 1M chart)
Since a volume profile section has been formed around 5.163, the point to watch is whether it can receive support and rise around 5.163.
-
(1W chart)
In the 4.404-5163 section, the M-Signal of the 1W chart > the M-Signal of the 1M chart, showing signs of transitioning to a regular array.
Accordingly, whether there is support around 4.404-5.163 is an important issue.
-
Based on the current price position, since the HA-High indicator of the 1W chart is formed at the 7.683 point, I think that it is highly likely that a full-fledged uptrend (stepwise uptrend) will begin if the price rises above 7.683 and maintains its level.
-
(1D chart)
The point of interest is whether it can receive support near 5.421 and rise above 6.605.
If it falls below the 5.050-5.218 range, you should check for support near 4.404.
-
Since the StochRSi indicator is located near the 50 point, there is a high possibility of volatility.
Therefore, you should check for support and decide when to trade.
-
Have a good time.
Thank you.
--------------------------------------------------
- Big picture
It is expected that the real uptrend will start after rising above 29K.
The section expected to be touched in the next bull market is 81K-95K.
#BTCUSD 12M
1st: 44234.54
2nd: 61383.23
3rd: 89126.41
101875.70-106275.10 (when overshooting)
4th: 134018.28
151166.97-157451.83 (when overshooting)
5th: 178910.15
These are the points where resistance is likely to be encountered in the future. We need to see if we can break through these points.
We need to see the movement when we touch this section because I think we can create a new trend in the overshooting section.
#BTCUSD 1M
If the major uptrend continues until 2025, it is expected to start by creating a pull back pattern after rising to around 57014.33.
1st: 43833.05
2nd: 32992.55
-----------------

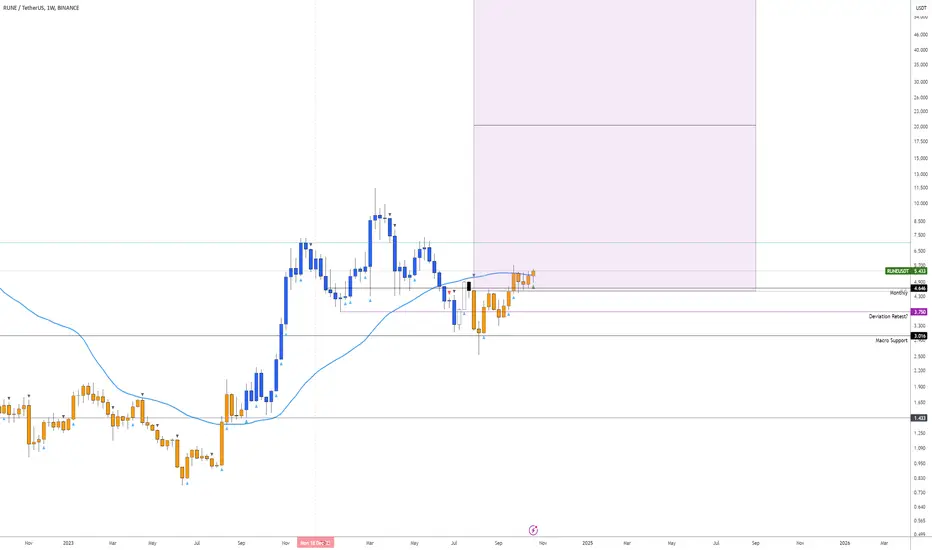
Targeting $20: RUNE’s Path to SuccessI had to create another post on RUNE because the last one got super messy with the entries at $3.23. CRYPTOCAP:RUNE
I wanted to highlight the strength it will have once it pushes above the moving average and starts printing blue candles. The last time it did that, it pulled a 7x, and this time I’m aiming for $20 as my first target.
The weekly chart is also active and could go berserk if it manages to close above the moving average and stay there.
I’m adding on dips and holding until BTC peaks around October next year... hopefully! www.tradingview.com