Copper Commodity USA Sun Storm Investment Trading Desk & NexGen Wealth Management Service Present's: SSITD & NexGen Portfolio of the Week Series
Focus: Worldwide
By Sun Storm Investment Research & NexGen Wealth Management Service
A Profit & Solutions Strategy & Research
Trading | Investment | Stocks | ETF | Mutual Funds | Crypto | Bonds | Options | Dividend | Futures |
USA | Canada | UK | Germany | France | Italy | Rest of Europe | Mexico | India
Disclaimer: Sun Storm Investment and NexGen are not registered financial advisors, so please do your own research before trading & investing anything. This is information is for only research purposes not for actual trading & investing decision.
#debadipb #profitsolutions
CE1! trade ideas

Potential Bearish ContinuationPrice has broken the ascending trendline and is moving below the ichimoku cloud , which supports our bearish bias that price will drop our pivot at 765.75 in line with the 38.2% fibonacci retracement to the support at 755.45 in line with the 50% fibonacci retracement . Alternatively, price may bounce off the pivot to the 1st resistance at 773.7 in line with the 23.6% fibonacci retracement and the 61.8% fibonacci projection .

Potential Bearish ContinuationPrice has broken the ascending trendline and is moving below the ichimoku cloud, which supports our bearish bias that price will drop our pivot at 765.75 in line with the 38.2% fibonacci retracement to the support at 755.45 in line with the 50% fibonacci retracement. Alternatively, price may bounce off the pivot to the 1st resistance at 773.7 in line with the 23.6% fibonacci retracement and the 61.8% fibonacci projection.

Jamie Gun2Head - Selling CopperTrade Idea: Selling Copper after 78.6% resistance
Reasoning: Intraday head and shoulders top, looking to hit measured move target
Entry Level: 4.276
Take Profit Level: 4.175
Stop Loss: 4.301
Risk/Reward: 4.04:1
Disclaimer – Signal Centre. Please be reminded – you alone are responsible for your trading – both gains and losses. There is a very high degree of risk involved in trading. The technical analysis , like all indicators, strategies, columns, articles and other features accessible on/though this site is for informational purposes only and should not be construed as investment advice by you. Your use of the technical analysis , as would also your use of all mentioned indicators, strategies, columns, articles and all other features, is entirely at your own risk and it is your sole responsibility to evaluate the accuracy, completeness and usefulness (including suitability) of the information. You should assess the risk of any trade with your financial adviser and make your own independent decision(s) regarding any tradable products which may be the subject matter of the technical analysis or any of the said indicators, strategies, columns, articles and all other features.

Elliott Wave View: Copper Looking to Turn Lower Soon Short Term Elliott Wave View in Copper (HG #F) suggests cycle from 4/5/2022 high ended as a 5 waves impulse structure at 4.0372. This impulse wave lower ended wave 1 in red. Wave 2 corrective rally is now in progress as double three Elliott Wave Structure. Rally from wave 1 began the first leg of the double correction. Wave (a) ended at 4.2062 and a pullback in wave (b) ended at 4.1332. Copper then resumed higher in wave (c) and ended at 4.2833 as wave ((w)) in higher degree.
Down from wave ((w)) high on May 17, wave (a) ended at 4.1915 and bounce in wave (b) ended at 4.2309. Then the metal extends lower in wave (c) towards 4.1316 which completed the connector as wave ((x)). Rally from wave ((x)) is a zig zag correction to complete wave ((y)) and wave 2. Wave (a) of ((y)) formed an impulse and ended at 4.3274. Correction in wave (b) ended at 4.2556. Next push higher we are calling an ending diagonal as wave (c) to complete wave ((y)) and the whole structure as wave 2 correction. This last leg higher should complete at 100% – 161.8% Fibonacci extension at 4.3776 – 4.53 where Copper should turn lower again or at least see 3 waves pullback.

Copper Commodity USA Sun Storm Investment Trading Desk & NexGen Wealth Management Service Present's: SSITD & NexGen Portfolio of the Week Series
Focus: Worldwide
By Sun Storm Investment Research & NexGen Wealth Management Service
A Profit & Solutions Strategy & Research
Trading | Investment | Stocks | ETF | Mutual Funds | Crypto | Bonds | Options | Dividend | Futures |
USA | Canada | UK | Germany | France | Italy | Rest of Europe | Mexico | India
Disclaimer: Sun Storm Investment and NexGen are not registered financial advisors, so please do your own research before trading & investing anything. This is information is for only research purposes not for actual trading & investing decision.
#debadipb #profitsolutions

copper update -18/05/2022downside focus remains in wave ((2)), expecting wave (C) of ((2)) to end at 3.77 ( wave (C) = 1.382 * wave (A) ).

Jamie's Gun2Head - Selling Copper Trade Idea: Selling Copper on 50% pullback
Reasoning: Rallied into resistance level, looking to continue move lower
Entry Level : 4.2170
Take Profit Level: 4.0370
Stop Loss: 4.2440
Risk/Reward: 6.67:1
Disclaimer – Signal Centre. Please be reminded – you alone are responsible for your trading – both gains and losses. There is a very high degree of risk involved in trading. The technical analysis , like all indicators, strategies, columns, articles and other features accessible on/though this site is for informational purposes only and should not be construed as investment advice by you. Your use of the technical analysis , as would also your use of all mentioned indicators, strategies, columns, articles and all other features, is entirely at your own risk and it is your sole responsibility to evaluate the accuracy, completeness and usefulness (including suitability) of the information. You should assess the risk of any trade with your financial adviser and make your own independent decision(s) regarding any tradable products which may be the subject matter of the technical analysis or any of the said indicators, strategies, columns, articles and all other features.

Copper Falls - An OpportunityIn May 2021, the nearby COMEX copper futures contract reached a record $4.8985 per pound. After a correction to just below the $4 level in August 2021, the red nonferrous metal made higher lows and higher highs, leading to another all-time peak at $5.01 per pound in early March 2022.
Range trading gives way to a downside break
Goldman Sachs believes higher highs are on the horizon
Copper is a green metal with the demand outstripping supplies
It will take a decade to bring new production online
Buying copper scale-down on the dip could be the optimal approach
The new record high on March 7 led to a period of consolidation where copper traded between $4.60 and $4.60 per pound. On April 25, the leader of the nonferrous metals fell below the bottom end of its trading range to the $4.40 level. The decline in copper could be the perfect opportunity to load up on the metal that Goldman Sachs calls “the new crude oil” because of its requirements for green energy technology.
Range trading gives way to a downside break
On May 7, the continuous COMEX copper futures reached a new all-time high at over $5 per pound.
The chart highlights the rally that took COMEX copper futures above the May 2021 $4.8985 peak to $5.01 per pound in early March. Copper rallied on the back of Russia’s invasion of Ukraine and the highest inflation readings in over four decades.
The chart illustrates July copper futures traded in a range from $4.4710 to $4.7660 per pound from mid-March through April 22. On April 25, the price dropped below the bottom of the range on the back of the prospects for higher US interest rates and the rising value of the US dollar against other world reserve currencies.
Higher rates increase the cost of carrying raw material inventories, and a strong dollar tends to be bearish for commodity prices as they rise in other currency terms. However, 2022 is anything but an ordinary year as inflation will keep real interest rates in negative territory, and all currencies, including the US dollar, are losing purchasing power.
July copper futures traded to the most recent low on May 2 at $4.2040 per pound, the lowest price in 2022, and since December 15, 2021, when it found a bottom at $4.1105. The short-term technical trend is bearish, but the longer-term path of least resistance remains bullish. Moreover, supply and demand fundamentals tell us that the current dip in the nonferrous metal is a buying opportunity.
Goldman Sachs believes higher highs are on the horizon
In 2021, as copper was on its way to the May $4.8985 high, Goldman Sachs’ analysts called copper the “new oil” because of its role in green energy technology. Electric vehicles, wind turbines, and other alternative energy initiatives require ever-increasing copper supplies. Goldman pointed out that decarbonization does not occur without copper.
The leading financial firm expects copper prices to rise to $15,000 per ton by 2025. At that level, COMEX futures will eclipse $6.80 per pound, nearly 60% above last week’s closing level at $4.2670. Other analysts expect even higher copper prices. Meanwhile, markets tend to move to prices on the up and downside that defy logic and reasonable and rational analysis. It is impossible to identify tops for bottoms in significant bull and bear market periods. The latest example was crude oil, which fell to below negative $40 per barrel in April 2020. No analyst saw that price coming.
Copper is a green metal with the demand outstripping supplies
Copper demand is set to rise over the coming years, but supplies to meet requirements will be a challenge for at least three reasons:
Addressing climate change - ironically, copper demand will rise because of green initiatives, but net-zero carbon emission pledges by mining companies will weigh on production. Copper production is energy-intensive, requiring hydrocarbons.
Rising production costs - Inflationary pressures have caused labor, financing, energy, equipment, and all mining input costs to rise, putting upward pressure on prices and downward pressure on output.
Supply chain and political issues - Global supply chain bottlenecks continue to cause problems in transporting all commodities from production sites to consumers. Moreover, the geopolitical landscape is creating price distortions. The war in Ukraine, sanctions on Russia, Russian retaliation, and the “no-limits” support between China and Russia create an ideological bifurcation with the US and Europe. China is the world’s dominant copper consumer. The tensions distort all raw material prices, and copper is no exception.
The prospects for a growing deficit in the copper market are high in 2022.
The five-year trend in LME copper warehouse inventories has made lower highs and lower lows, indicating that robust demand is outpacing supplies.
It will take a decade to bring new production online
The cure for high prices in commodities is always the high price level as producers step up output to take advantage and earn more profits. In copper, it takes eight to ten years to bring a new mine into production, meaning the high prices in 2022 will only yield new and higher output in 2030. Moreover, the leading mining companies are scouring the world for new proven and probable reserves. BHP, a leading mining company, is even exploring the potential for a copper project in the challenging political climate of the Democratic Republic of the Congo. BHP calls the area a “tougher jurisdiction” because of the DRC’s long history of corruption and political instability.
The bottom line is production will struggle to keep up with copper’s growing demand.
Buying copper scale-down on the dip could be the optimal approach- A similar pattern to the May through August price behavior
The latest price action in the copper futures market looks very similar to the move from the May 2021 high to the August 2021 bottom.
The chart shows the decline from $4.8985 in May 2021 to a low of $3.98 in August 2021, an 18.8% correction in five months. Copper futures only traded below the $4 level for one day in August 2021.
The most recent correction took the red metal from $5.01 to $4.1900 per pound or 16.4%. If copper holds above the $3.98 level, it will make another in a long series of higher lows since the March 2020 bottom at just over $2 per pound.
I favor buying copper on a scale-down basis as supply and demand fundamentals and the long-term technical trend remain bullish. The short-term trend is bearish, but that could be an opportunity for those looking to accumulate the nonferrous metal that is a critical component in climate change initiatives. I expect higher highs in copper over the coming years.
--
Trading advice given in this communication, if any, is based on information taken from trades and statistical services and other sources that we believe are reliable. The author does not guarantee that such information is accurate or complete and it should not be relied upon as such. Trading advice reflects the author’s good faith judgment at a specific time and is subject to change without notice. There is no guarantee that the advice the author provides will result in profitable trades. There is risk of loss in all futures and options trading. Any investment involves substantial risks, including, but not limited to, pricing volatility , inadequate liquidity, and the potential complete loss of principal. This article does not in any way constitute an offer or solicitation of an offer to buy or sell any investment, security, or commodity discussed herein, or any security in any jurisdiction in which such an offer would be unlawful under the securities laws of such jurisdiction.

Copper possible scenarioPossible trend turn, Fib level reject the downtrend in the weekly candle. That is a good sign

Copper - next bullish run ? After the next rate hike was confirmed for May, commodities and equities alike took part in a sell-off.
Copper, like silver, was very volatile. However, I think that the next interest rate hike has already been priced into commodity prices. The reaction to the Ukraine invasion has been sold off again and is again reaching the pre-level.
From a technical point of view, one can see a lot of bullish supports. This includes a semicircle undercircle and a bullish triangle in pattern form.
However, should the circle fail, we still have the triangle's hypotenuse as support.
From a fundamental point of view, there are also bullish arguments. Due to the zero-Covid policy in China, it may well be that the effects on the transport chains will be felt again later in hindsight.
If you have anything to add, please write it in the comments.
Thank you for your attention

Copper Futures (HG1! ), H1 Potential for Bearish DipType : Bearish Dip
Resistance: 4.5250
Pivot: 4.4920
Support : 4.4205
Preferred case: We see the potential for a bearish dip from our pivot level of 4.4920 which is in line with 78.6% Fibonacci retracement extension towards our 1st support level of 4.4205 which is in line with 78.6% Fibonacci retracement .
Alternative scenario: Alternatively, price might break our pivot structure and head for 1st resistance level of 4.5250 in line with 38.2% Fibonacci retracement and 127.2% Fibonacci extension .
Fundamentals: No major news.

Copper Futures (HG1! ), H1 Potential for Bearish DipType : Bearish Dip
Resistance: 4.5250
Pivot: 4.4920
Support : 4.4205
Preferred case: We see the potential for a bearish dip from our pivot level of 4.4920 which is in line with 78.6% Fibonacci retracement extension towards our 1st support level of 4.4205 which is in line with 78.6% Fibonacci retracement.
Alternative scenario: Alternatively, price might break our pivot structure and head for 1st resistance level of 4.5250 in line with 38.2% Fibonacci retracement and 127.2% Fibonacci extension.
Fundamentals: No major news.

Copper: Bullish Move From Key Level
Copper reached a very peculiar confluence zone:
we see a perfect match between a horizontal daily demand area,
618 and 786 retracement levels of the last two bullish impulses.
Analyzing the candlesticks, we may spot a nice dodji candle being formed on that structure.
Then, analyzing an intraday perspective, I spotted a bullish breakout of a falling wedge pattern formation.
I assume that it will trigger a bullish move.
Resistances on focus: 800 / 805
❤️If you have any questions, please, ask me in the comment section.
Please, support my work with like, thank you!❤️

Copper Commodity India Sun Storm Investment Trading Desk & NexGen Wealth Management Service Present's: SSITD & NexGen Portfolio of the Week Series
Focus: Worldwide
By Sun Storm Investment Research & NexGen Wealth Management Service
A Profit & Solutions Strategy & Research
Trading | Investment | Stocks | ETF | Mutual Funds | Crypto | Bonds | Options | Dividend | Futures |
USA | Canada | UK | Germany | France | Italy | Rest of Europe | Mexico | India
Disclaimer: Sun Storm Investment and NexGen are not registered financial advisors, so please do your own research before trading & investing anything. This is information is for only research purposes not for actual trading & investing decision.
#debadipb #profitsolutions

Copper May Put in Fresh 2022 Lows if Key Moving Average Breaks Copper prices are probing its 200-day Simple Moving Average after a bout of weakness. A clean break lower would expose the 2022 low at 4.2820, with a deeper pullback potentially threatening the 4.0000 psychological level.

Copper - 26/04/2022the push higher than 5.04 will let us expect that wave 3 of (5) is in play, on the other side the move lower than 4.28 will let us expect that the larger flat correction in wave ((2)) started

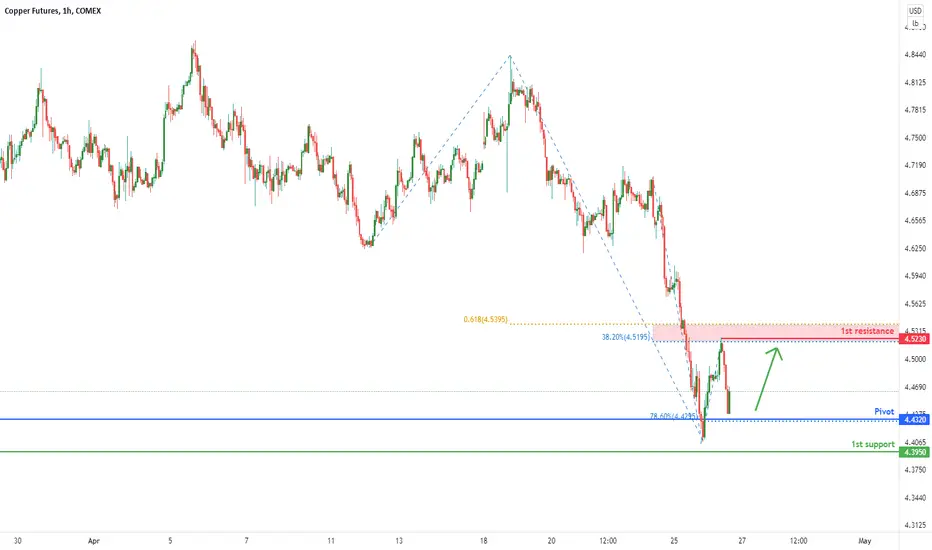
Copper Futures ( HG1!), H1 Potential for Bullish BounceType: Bullish Bounce
Resistance: 4.5230
Pivot: 4.4320
Support: 4.3950
Preferred case: Price is moving nearer to the key pivot level. We are expecting the price to potentially bounce off from our pivot level of 4.4320 in line with 78.6% Fibonacci retracement towards our 1st resistance level of 4.5230 which is in line with 38.2% Fibonacci retracement and 61.8% Fibonacci projection.
Alternative scenario: Otherwise, the price might break our pivot structure and trigger a dip to the 1st support level of 4.3950 in line with a previous horizontal swing low support.
Fundamentals: No major news.
COPPER-NEUTRAL to upsideWe have traded below the cloud like some other precious metals, and now it should relax a little.
Copper current $ 4.55 will consolidate and likely move back towards $ 4.75-4.80. For now if short, take back in profit, or ther wise wait for the up move and go short once again.

Copper: Classic Trend-Following Setup
Copper is trading in a strong bullish trend.
Since the middle of March, the market was consolidating within a horizontal trading range.
The market broke and closed above its upper boundary yesterday.
Now I expect a bullish continuation to 855
❤️Please, support this idea with like and comment!❤️

Copper Futures ( HG1!), H1 Potential for Bearish DipType : Bearish Dip
Resistance : 4.7890
Pivot: 4.7740
Support : 4.7375
Preferred case: We see the potential for a bearish dip from our pivot at 4.7740 in line with 138.2% Fibonacci extension towards our 1st support at 4.7375 in line with 38.2% Fibonacci retracement and 61.8% Fibonacci projection.
Alternative scenario: Alternatively, price may break our pivot structure and head for 1st resistance at 4.7890 in line with 161.8% Fibonacci extension.
Fundamentals: No major news.

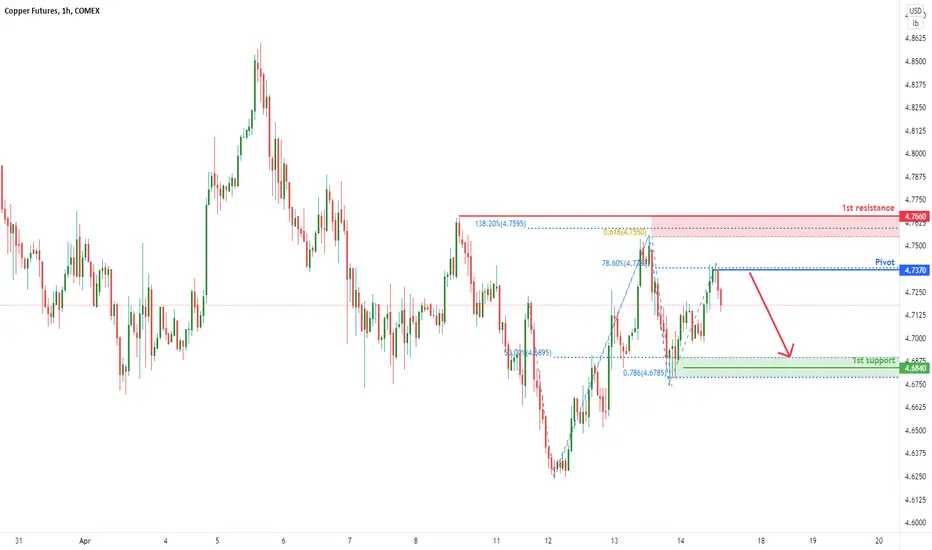
Copper Futures ( HG1!), H1 Potential for Bearish DipType : Bearish Dip
Resistance : 4.7660
Pivot: 4.7370
Support : 4.6840
Preferred case: We see the potential for a bearish continuation from our pivot at 4.7370 in line with 78.6% Fibonacci retracement our 1st support at 4.6840 in line with 50% Fibonacci retracement and 78.6% Fibonacci projection .
Alternative scenario: Alternatively, price may break our pivot structure and head for 1st resistance at 4.7660 in line with 61.8% Fibonacci projection and 138.2% Fibonacci extension .
Fundamentals: No major news.

Copper Futures ( HG1!), H1 Potential for Bearish DipType : Bearish Dip
Resistance : 4.7660
Pivot: 4.7370
Support : 4.6840
Preferred case: We see the potential for a bearish continuation from our pivot at 4.7370 in line with 78.6% Fibonacci retracement our 1st support at 4.6840 in line with 50% Fibonacci retracement and 78.6% Fibonacci projection.
Alternative scenario: Alternatively, price may break our pivot structure and head for 1st resistance at 4.7660 in line with 61.8% Fibonacci projection and 138.2% Fibonacci extension.
Fundamentals: No major news.