CE1! trade ideas


Copper Down Long TermThe recent record highs in copper seems to be quite over done.
Chart has formed a backward wedge of some sort, which typically reverses down.
Expect copper to slowly move south over the coming month to the 61% FIb level.


Falling WedgeIt was in a downwards trend, then found some support. Now downwards trend became downwards wedge, trade in wedge or wait for break.
Chart and moving average says to short for 8hrs to stay in the wedge pattern and retrace to the support line...


Time to Buy CopperCopper consolidated significantly after reaching overbought levels on weekly charts even. Now it has reached a very strong support level from where it should bounce back. I have decided to go long on copper from 3.45 and will ride it to the 3.65 levels. A good time to Buy Copper


Long /HG- Inside bar at neckline, followed by upward inside bar and a key reversal.
- Busted double top.


POSITIONAL LONG VIEW IN #COPPER MCX BO RE - TETS CMP 738 & 50 DMPOSITIONAL LONG VIEW IN #COPPER MCX BO RE - TETS CMP 738 & 50 DMA 738 65 HOLD CONTINUOUS 2 DAYS
MCX COPPER @ 742
STOP LOSS 725 ON CLBS
TARGET 750 762 772 781 793 712 +++ NEW HIGH

Detailed Elliot Wave Analysis of Copper with Predictions
The recent rally in Copper prices sure feels like a wave 3. Volume is great. In wave 3 according to RN Elliot is usually the most powerful wave in a trend. Prices rise quickly and corrections are very short lived and shallow. Anyone looking to get in on a pullback will likely miss the boat. As wave three starts, the news is probably still bearish, and most market players remain negative; but by wave three's midpoint, "the crowd" will often join the new bullish trend. Wave three often extends wave one by a ratio of 1.618:1. This is where we are at currently at 1.618. Looks to me this is the End of wave 3. Anyone looking to get in should wait for wave 4 to play out which will provide a very good risk reward trade. And according to RN Elliot research Wave 5 is the largest in the commodities.
Note - If wave 4 Monthly closed anywhere in the price range of wave 1 this idea is invalid
This is my preferred count of Elliot wave Analysis on Copper. It’s a logarithmic chart. So we had a 15.5 years long Ending Diagonal which ended with a explosive breakout. Followed by Double Combo WXY. W was an Expanded Flat with C Wave going deep testing the breakout point of the Diagonal. And then X wave correction in three waves marked abc. And then the y wave which is the larger trend finished higher than W which is unusual case. I have given the subwave count of wave 1.
Subwave count of wave 3 :
Wave 1 finished at median line of pitchfork
Wave 2 was a running flat correction
Wave 3 almost kissed the 1.0 line of the pitchfork
Wave 4 correction was a symmetrical triangle broke out in the direction of B wave. It also comply with guide of alteration.
And looks like we my have just ended subwave 5 and Main wave 3 as you can see in the chart it has made a lower low on daily timeframe
Thank you for reading
Will appreciate your feedback

Copper ShortSeasonality is showing weakness at the end of june, so its abouve time to get into short postions on copper and maybe also gold...

Quick 20 point profit on CopperSnagged a quick $25.00 on a Copper trade as price action quickly moved down through my 30HMA. I set a TP of 20 points which is pretty safe. I left some profit on the table but am happy with a profit.

Copper futures - HG1! - EW analysis - double zigzag Copper - It has completed impulse cycle upside and now correcting down in double zigzag WXY where Y is in progress. The invalidation level for the set ups is 4.7085 and probable target zone will be below 4.30 level.

Copper Starting to Look Weaker Rather Than StrongerSupply entered the market in February evidenced by the close at approx 3/4 and confirmed by March's bar - a down bar of similar volume closing slightly above the halfway point of February's bar. March's bar was approximately only half the spread of February's bar indicating that there wasn't good ease of movement to the downside. The close in the bottom third of the bar also indicated that buyers were still present.
April confirmed this fact with a widespread upbar on slightly reduced volume closing close to the top of the bar. The spread of the bar although being widespread was still less than that of February, and the close did not provide much gain over February's high indicating that although buyers were present they were having to exert far more effort to markup prices.
This was confirmed by May's bar with a reduced spread, increased volume and close at the midpoint indicating both a reduced ease of movement to the upside and supply entering the market.

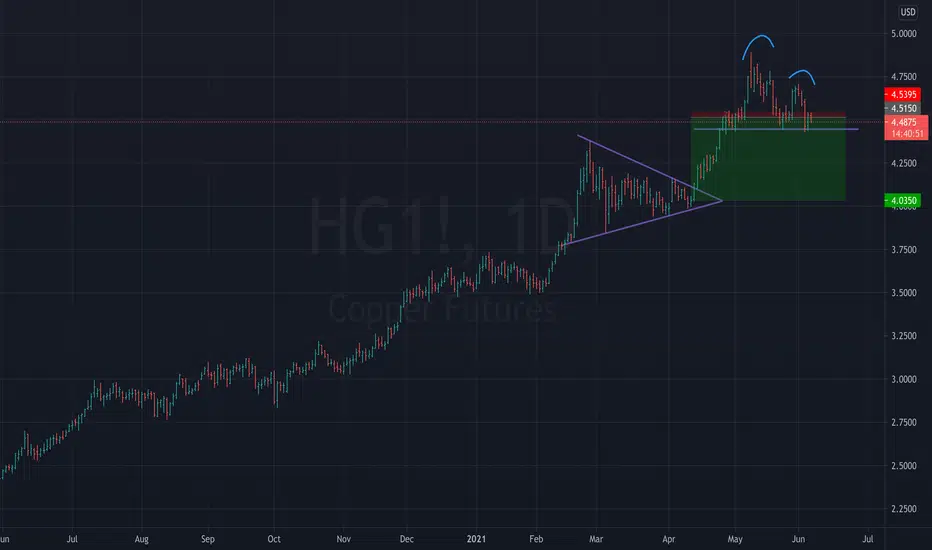
🏛COPPER SWING ANALYSIS|LONG🚀
🏛COPPER is trading in an uptrend in a rising channel
And as you can see on the chart number 1
The metal broke the pervious all time high with ease on the daily
But then retraced back below the level
While staying inside the rising channel
All of the above paints a mixed picture
But until the channel gets broken,I will remain bullish
But further growth will depend on the coppers ability to fix itself above the key level
If it fails to do so, we will see a bearish breakout eventually
And the price will go down to the nearest support
LONG🚀
✅Like and subscribe to never miss a new idea!✅

Copper to silver ratioUpdate on my Dr Copper to Dr Silver ratio.
Starting to look more true (I expected a reversal to the downside). Again, it doesn't mean #copper performs poorly, it just means #silver is going to out-perform. I still expect copper miners to obviously keep up. See second chart.

Copper 4 hour. Cleared for long setups on lower timeframes.I think non-stock / non-treasury futures instruments are still trading on Memorial Day, but I will find out for sure tomorrow.
If they are copper looks to be in an excellent position to consider long opportunities on the lower timeframes.


BEWARE IMPORTANT COPPER PRICE LEVEL - HG1! - COPPER - DAILYThank you for your likes and comments! Really appreciated! This is an idea about Copper price, not a financial advice.
___________________________________________________________________________________________________
The HG1! Copper Futures have been continuously rising... almost a year.
We realized that summer is coming and that this market have been beating all the selling power trying to bring it down of slower it>
How long is it going to last?
The blue lines represent the channel that the price is following. Being at the top of this channel and seeing a possible strong signal of a pullback, the probability of seeing the market profile change has risen.
The volume involved where huge but will it again beat it and keep going up further?
The next step down is probably at the dotted red horizontal line. Some other "super volumes" interventions happened in that past at that price level.
For a day traders, this is probably something to keep an eye on> For a longer term trader, lowering the exposition is probably smart at this price level. Reentering step by step after this level is passed or when the deep happens.
