Gold’s on a Roller Coaster — and We’re Riding It Down🎢 Gold’s on a Roller Coaster — and We’re Riding It Down 🎢
Gold just snapped up like it saw Trump tweet “TARIFFS ARE BACK” — but the move smells like a knee-jerk algo pump, not real conviction. We just rejected right into a thin-volume imbalance zone and tagged the underside of a long-standing trendline.
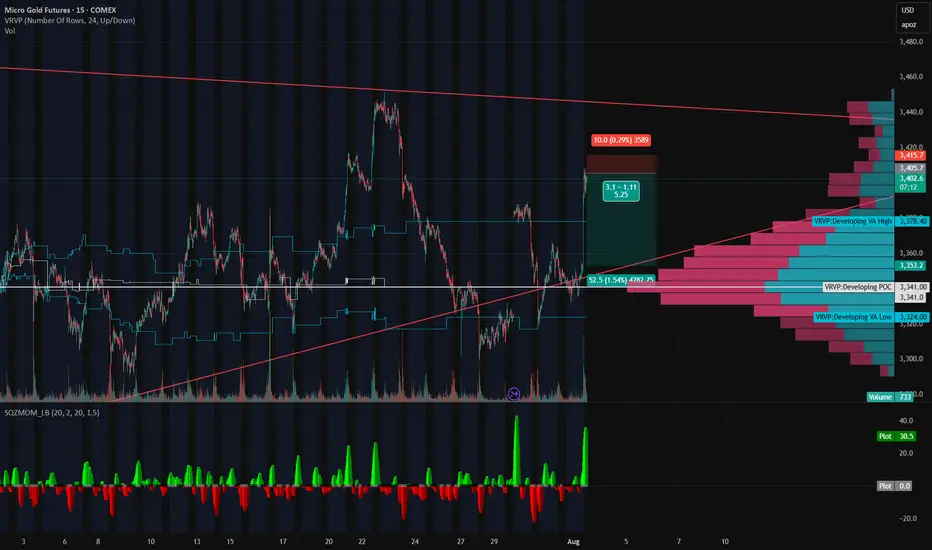
📉 Short Setup Locked In:
💥 Entry: 3405
🛑 Stop: 3415
🎯 Target: 3353
💰 R:R ≈ 5:1
🔍 Why I'm In This Trade:
That rip? Total headline panic, not structural strength.
Low volume shelf above, with a massive POC magnet below at 3353.
We tapped the Developing VAH (3414) and got rejected — classic trap setup.
SQZMOM showing the energy is already fizzling. Green flash, no follow-through.
🧠 The Narrative:
Gold’s trying to price in volatility from every angle — Trump talk, tariffs, macro chaos — but under the hood, this pop looks unsustainable. If this is just a liquidity grab, we could see a flush back into the meat of value fast.
Grab your helmets — this roller coaster might just be heading downhill 🎢📉
GD1! trade ideas
Close out the Week STRONGLooks like price has found its bottom and is ready to push from here. We are looking for a strong forceful break out from this zone so we can go for the higher levels. Everything looks right from here and value keeps shifting up. I know we should get a solid entry but waiting for it to line up with time.

Gold Daily Bias – Bulls Have the Ball, But Watch the TrapGold Daily Chart – August Outlook
Bias is still bullish for August.
Price is holding well above the big 3M FVG ($2,900–$3,100).
Strong bounce from Weekly Low ($3,331) heading toward Weekly High ($3,416).
Above $3,416 we’ve got $3,451 (M-H) and ATH ($3,508) as liquidity targets .
Seasonal tailwinds could help push us higher into Q4.
Blind spots to watch:
Still range-bound between $3,330–$3,450 for months — no clean break yet.
Unfilled FVG near $3,210 could be a draw if we reject from resistance.
August liquidity is thin — spikes can reverse fast.
Triple-top risk if we reject near $3,450 again.
Game plan:
Bullish if we get a daily close above $3,416 (confirmation) and ideally above $3,451 to aim for ATH.
If breakout fails, I’ll target range play back toward $3,290–$3,210.
Bias = bullish, but I’m staying nimble.

GOLD: NEW WEEK TECHNICAL BIAS (MARKET OPEN)CONTEXT
▪︎ HTFs Bias: Bullish stance remains intact until a valid structural breach occurs.
▪︎ Monthly Context: Despite consistent upper wick rejections, price continues to close above prior monthly opens — suggesting bullish resilience.
▪︎ Weekly View: Current price action reflects a Value Compression Phase (VCP) within the premium zone of the active range, implying potential buildup for a bullish Impulse Drive.
▪︎ Daily Alignment: Daily price behavior mirrors the Weekly context, supporting a continuation thesis.
Preferred Scenario: Leaning towards a Retrace Precision Entry (RPE) before the Ascend Sequence resumes. Watching:
• Point A (shallow pullback) near B/C level, or
• Point B (deep pullback) into the pending Rejection Zone (ARB).
Invalidation Trigger: A structural breach below 3336, backed by bearish momentum and microstructure shift, targets first 3280, then levels below.
Uncertainty Variable: Will price first sweep 3433.2 before retracing? Or will it retrace from market open? This remains unclear and demands a patient, reactive stance.
📌 Disclaimer: This is a strategic directional bias, not financial advice. Execute only with confirmation and proper risk management.

GC1! – The Wedge Strikes BackGC1! – The Wedge Strikes Back 🚀
Gold futures (GC1!) just gave us a textbook rollover move. As the front-month rolled, price faked a wedge breakdown, only to rip back inside the structure once rollover completed. That failed breakout speaks volumes – and now the wedge is back in control.
Rollover Trap → Back Inside the Wedge
Rollover volatility flushed price below the wedge, pulling in shorts… but the move didn’t stick. Buyers stepped up and snapped price back inside, turning the wedge’s lower boundary into rock-solid support once again.
The Long Game 🎯
With GC1! holding the wedge:
Longs off wedge support are the play
Resistance: 3,380
Target: 3,446 (upper wedge boundary)
Stop-loss: 3,336 (below support)
Risk/Reward: 🔥 10.69 RRR
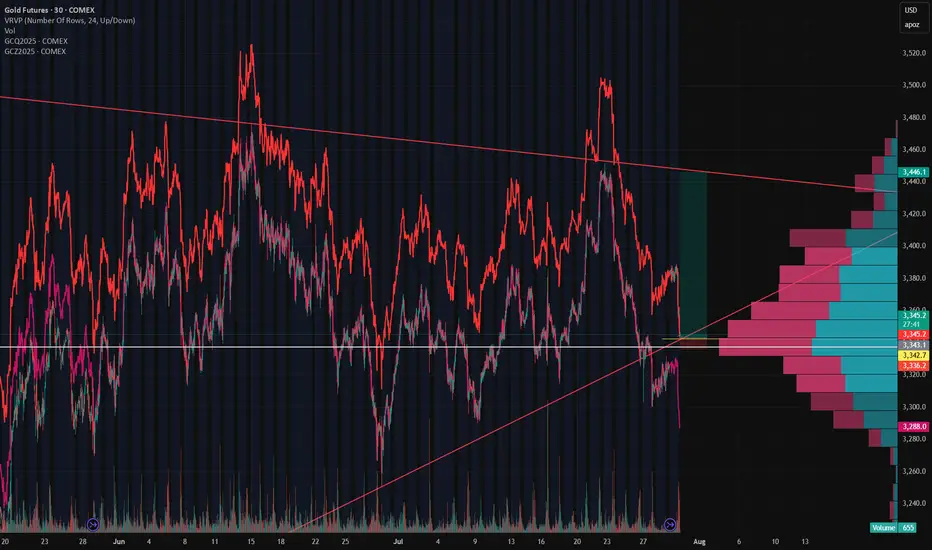
Volume Profile also shows heavy accumulation in the 3,336–3,380 zone – crack through 3,380, and we could see momentum accelerate quickly.
Bottom Line
This isn’t just another bounce – it’s a failed breakdown on rollover. Wedge traders are back in the driver’s seat, and the setup offers a crystal-clear invalidation point with serious upside potential.
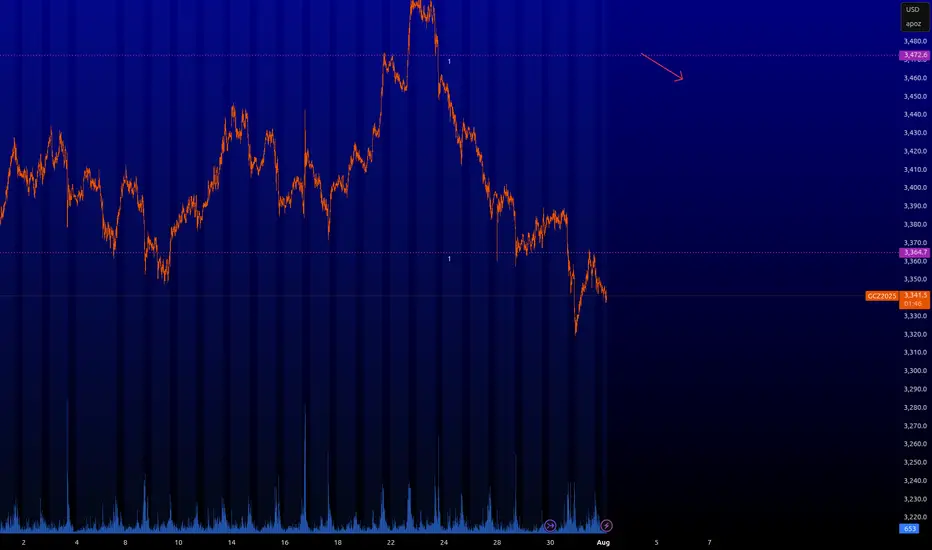
Gold rinse and repeatSimple, more shorts on gold as it looks like a rinse and repeat from previous sessions price action
GC AnalysisWith stability signs appearing the gold is loosing its shine. With GC trading in a range.

WE GOT THE SWEEP ON GOLD!!!!THIS is the move I was waiting for! we got the full sweep on levels. looking for price to flip back to bullish pressure from here. Now we just wait for the entry to show as we move into the Asian Killzone.

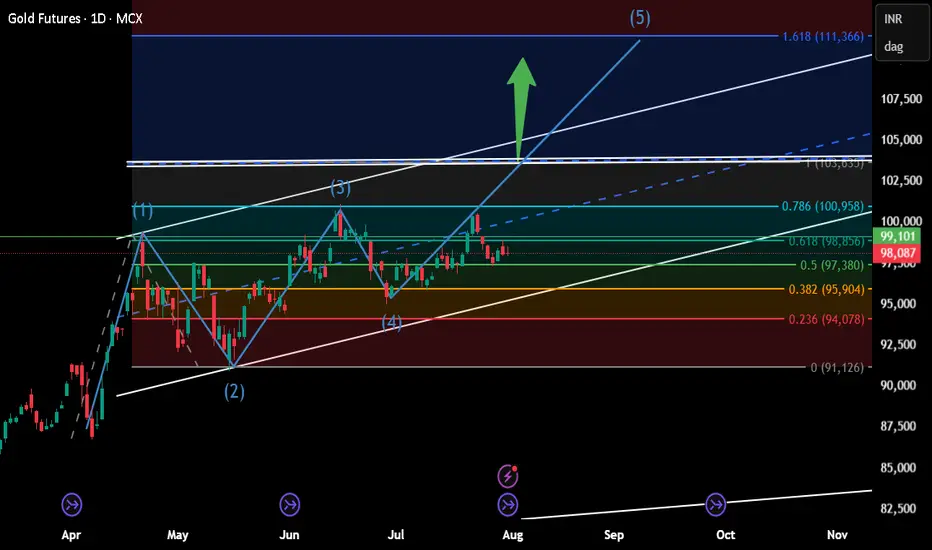
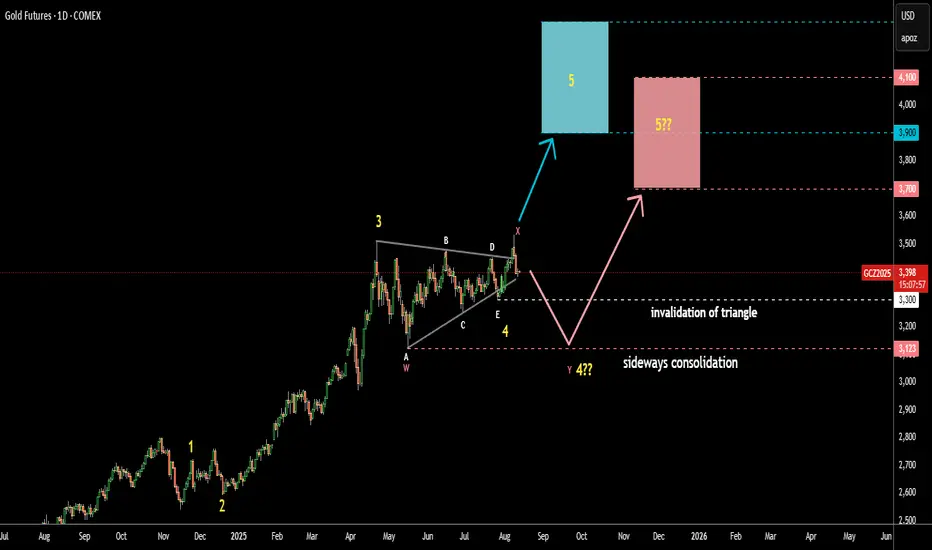
Gold Update 13AUG2025: Risk of Sideways Consolidation Last Friday, August 8, the price failed to progress above the April top as it closed underneath. Hence, there are two possible scenarios from here:
The price could have just completed the first wave up in a larger wave 5, and we may see a retracement. This setup remains valid as long as the price stays above the last wave E of the Triangle at $3,300.
The large sideways consolidation (WXY) might take shape, potentially retesting the bottom of wave A at $3,123. In this case, the target could drop lower, with potential support in the pink box area between $3,700 and $4,100.
Which one do you think plays out?
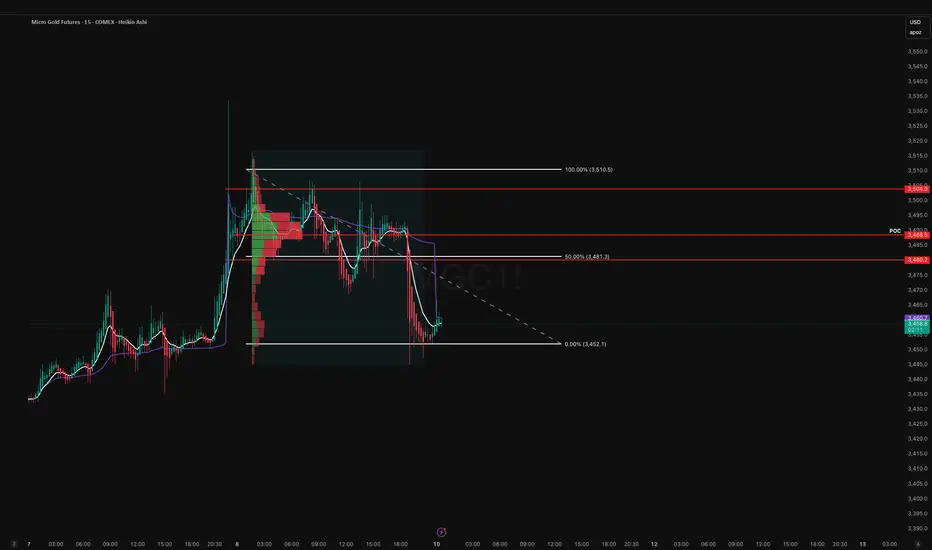
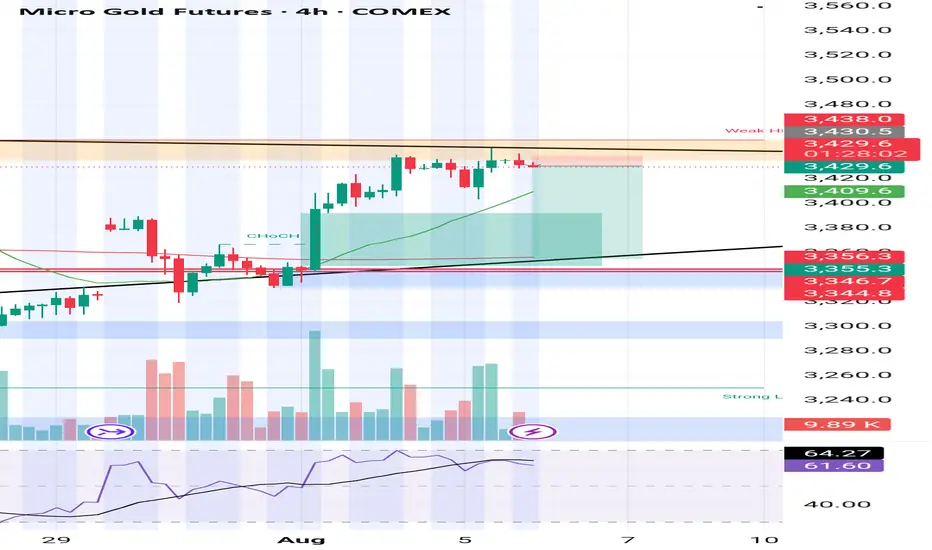
Support’s on Life Support. Paging Dr. TokyoMGC is currently trading at 3,393.8, positioned at the 0% retracement of the recent leg from 3,510.2 down to current lows. The prior swing high at 3,510.2 marks the 100% Fib, with the 50% retracement at 3,451.18 acting as the mid-range pivot. Price action has been in a sustained downtrend since rejecting the 50% retracement level, with EMAs aligned bearish on the H1.
The Point of Control (POC) for this distribution is located at 3,492.0, which coincides with the upper value area, untested since the selloff.
Bias Assessment:
- Bearish Bias: 60% Probability
- Bullish Bias: 40% Probability
- Volatility Expectation: Moderate in Asian session, potential acceleration on key level breaks due to lower liquidity.
Bearish Scenario – Primary Path:
- Breakdown confirmation requires an H1 close 3,393.4 (0% Fib).
- Immediate target: 3,365.0 (local structural demand)
- Extended target: 3,350.0 (measured move completion / previous support cluster)
- Risk trigger: Failure to break 3,393 followed by reclaim of 3,410 negates short bias.
Bullish Scenario – Alternate Path:
- Defense of 3,393.4 with absorption will reclaim 3,410.0 (minor LVN).
- Upside target 1: 3,451.18 (50% Fib, key mid-range)
- Upside target 2: 3,492.0 (POC, high-volume resistance)
- Continuation trigger: Break and hold - 3,492 opens 3,510.2 retest.
Key Tokyo Session Levels:
- Support: 3,393.4 → 3,365.0 → 3,350.0
- Resistance: 3,410.0 → 3,451.18 → 3,492.0 → 3,510.2
Tokyo session tends to front-load stop hunts in the first 15–30 minutes. Prefer confirmation based entries at key level breaks with tight stops in low-liquidity conditions. Position sizing should be reduced relative to NY/London volatility profile.
Happy Trading

Shorting GoldWell, it does looks like short needs to be shorted.
I mean on bigger timeframes, the price has been rejected and corrected hard from the 3,533 area. This also means that there is tons of liquidity that is waiting to be taken above that level.
So just to cut short the confusion, technically, once the price tapped into that level, it rejected and broke a bullish leg. So technically i would say that we are at least going to correct.
Also i have identified the area of interest with entry and targets.
Hopefully it goes through.
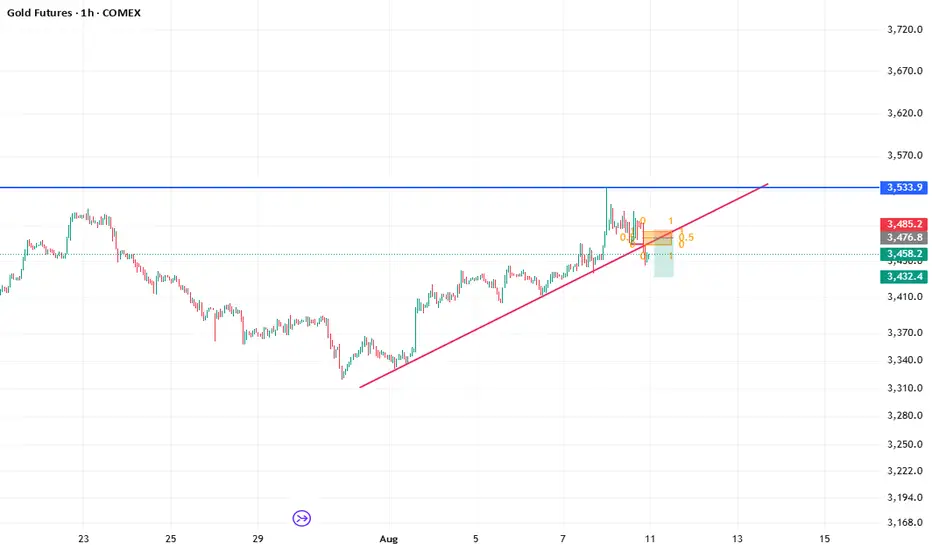
Tokyo Gold Fight Club. First Rule: Respect the POCGold is setting up for a clean Tokyo session play, and the chart structure couldn’t be clearer. We’re currently sitting just above the 0% Fib at 3,452.1, after a controlled rotation down from the Point of Control at 3,488.5. That POC is key it’s where the highest traded volume of the session sits, meaning it’s a true decision point for buyers and sellers.
The 50% Fib at 3,481.3 lines up with a low volume node, which often acts as a springboard or rejection zone depending on who’s in control. Above that, we have a tight resistance cluster the POC, the psychological level at 3,500, and the 100% Fib at 3,510.5 all stack together, creating a major liquidity magnet if price can rally into it.
My primary bias into Tokyo is bearish (around 65% probability) unless we see a decisive breakout above 3,500. The preferred short setup is a push into 3,480–3,490 that fails to hold, with stops above 3,500 to stay safe from any thin session spikes. In that case, I’m targeting the session low at 3,452.1 first, then 3,435 for the second scale-out, and finally 3,420 if sellers press the advantage.
The alternative scenario, with a 35% probability, is a clean break and hold above 3,500, which flips bias long. In that case, the upside play would be to enter on a breakout retest, with stops back under the POC at 3,488, targeting the Fib high at 3,510.5 first and then 3,525 as a stretch target.
Tokyo tends to give one of two plays in gold: either a low volume POC retest that rejects and runs in the prevailing direction, or a sharp reclaim of a key level that forces an aggressive squeeze. Until proven otherwise, I’m watching 3,480–3,490 as the battleground and planning to short rejection wicks there, keeping risk tight and targets clearly defined.
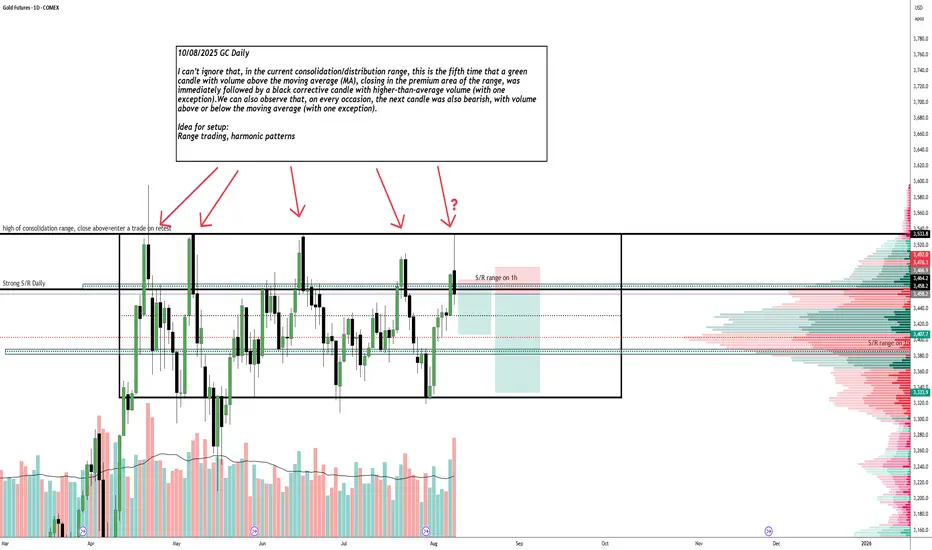
GC shortAs on Chart, failed breakout of the range
Daily range, price test the top of the range, it happened 4 time before, low of the range isn't weakening, to many news, it looks like noone is sure what will happen with economy and we are stuck in this range
Gold. Weekly Walkthrough. 10.08.2025,SundayCOMEX:GC1!
One-sided bullish expansion on Gold. Already outlined in the previous video

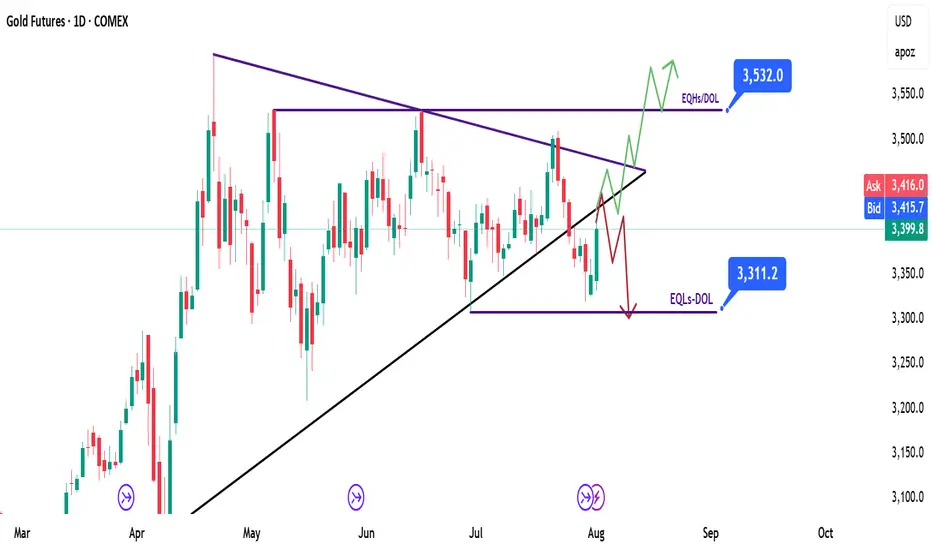
GOLD | XAU/GC - Weekly Recap & Gameplan - 03/08/25📈 Market Context:
Gold is currently trading within an accumulation zone as the market begins to price in a potential 0.25% rate cut by the Fed.
This macro expectation is supporting the broader bullish bias in the commodities market.
🧾 Weekly Recap:
• Price broke below the HTF bullish trendline — a key sign of weakness and potential structural shift.
• However, a sharp drop in the DXY (US Dollar Index) provided a bullish tailwind for gold, resulting in a mid-week bounce.
• This mixed action sets the stage for two potential outcomes next week.
📌 Technical Outlook & Game Plan:
I’m preparing for two possible scenarios:
1️⃣ Bearish Scenario (Red Path):
→ Price retests the broken trendline and rejects it
→ Continuation to the downside
→ Play: Short setup
2️⃣ Bullish Scenario (Green Path):
→ Price reclaims the broken trendline and closes above it
→ Continuation higher toward next resistance
→ Play: Long setup
🎯 Setup Trigger:
I will wait for a clear break of structure (BOS) on the 1H–4H timeframe to confirm directional bias.
📋 Trade Management:
• Stoploss: Below the demand zone (for longs) or above supply (for shorts) on the 1H–4H chart
• Target:
→ Bullish: $3,536
→ Bearish: $3,305
💬 Like, follow, and comment if this breakdown supports your trading! More updates, setups, and educational posts coming soon — stay tuned!
Gold’s weekly chart looks strong Gold futures has been teasing $3500 for a few weeks now and every time it gets to $3350 the shorts roll in and the buyers continue to show their strength.
If prices breaks above and maintains the $3475 support before the week ends; then we will see a strong run above $3500 next week.
Lastly, the EMA 20 & 50 as well as the RSI are all bullish on the 1hr, 4hr, and 1w timeframes.
Always remember the trend is your friend!

GC : Key levelsHere are the key levels that the market will be interested in. You can scalp from 3.472.
⚠️ VOLATILITY WARNING ⚠️
Trading around major news can be extremely unpredictable. Trade responsibly!
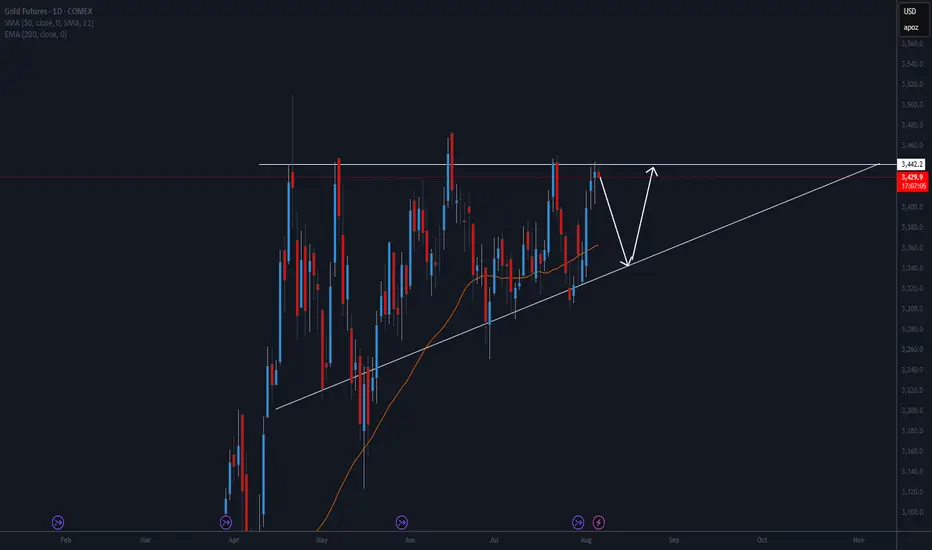
Potential breakout As we observe GC in the Daily timeframe, it's been consolidating in this sort of range for a while now. With the higher lows and 3442 level acting some sort of resistance, we may see some sort of breakout soon. If not, we can see it going back down and MAYBE creating another higher low
Gold Analysis On 4th Aug 2025As analyzed, the market took support at the accumulation zone and then moved in its original upward direction, reaching around 100,600. Currently, the market is still within the same zone. Further analysis will be done next Monday. Thank you all
Key Zone 100600

#GOLD #XAUUSD Seems to have ended the correction FX_IDC:XAUUSD Gold Spot might have completed the correction as a complex 3-3-5 FLAT, and is currently turning higher in wave (ii), however this get invalidated if THE LAST LOW OF 3268.19 BREAKS. Till the pivot 3268.19 stays strong, the move should be impulsive and take us to new high near term.

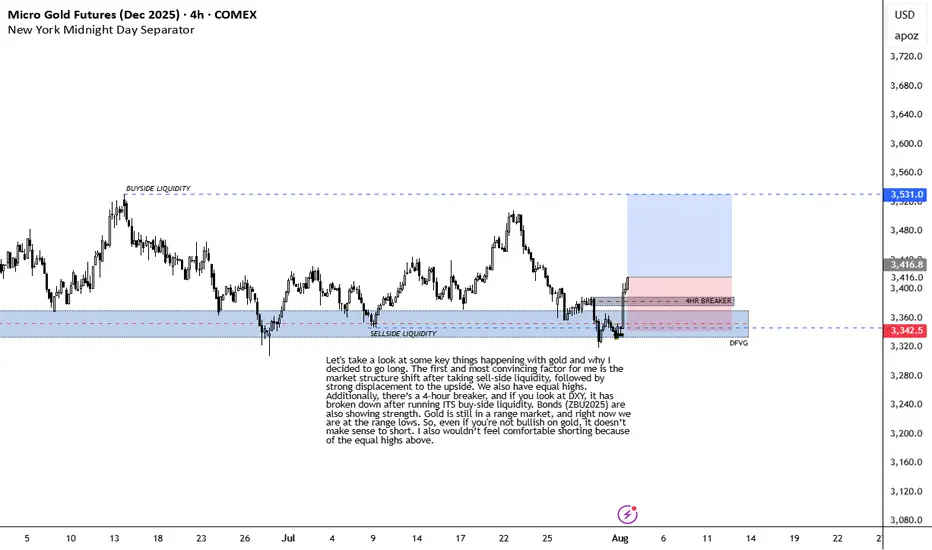
BULLISH ON GOLDLet's take a look at some key things happening with gold and why I decided to go long. The first and most convincing factor for me is the market structure shift after taking sell-side liquidity, followed by strong displacement to the upside. We also have equal highs. Additionally, there’s a 4-hour breaker, and if you look at DXY, it has broken down after running ITS buy-side liquidity. Bonds (ZBU2025) are also showing strength. Gold is still in a range market, and right now we are at the range lows. So, even if you're not bullish on gold, it doesn’t make sense to short. I also wouldn’t feel comfortable shorting because of the equal highs above.
INVALIDATION IS RECENT 4HR LOW.