GOLD – New Week Technical Bias (Market Open)
Structural Outlook:
The broader bullish sequence remains valid, with no structural breach confirmed yet.
However, price is currently reacting at a sensitive level, warranting measured caution.
Zone Dynamics :
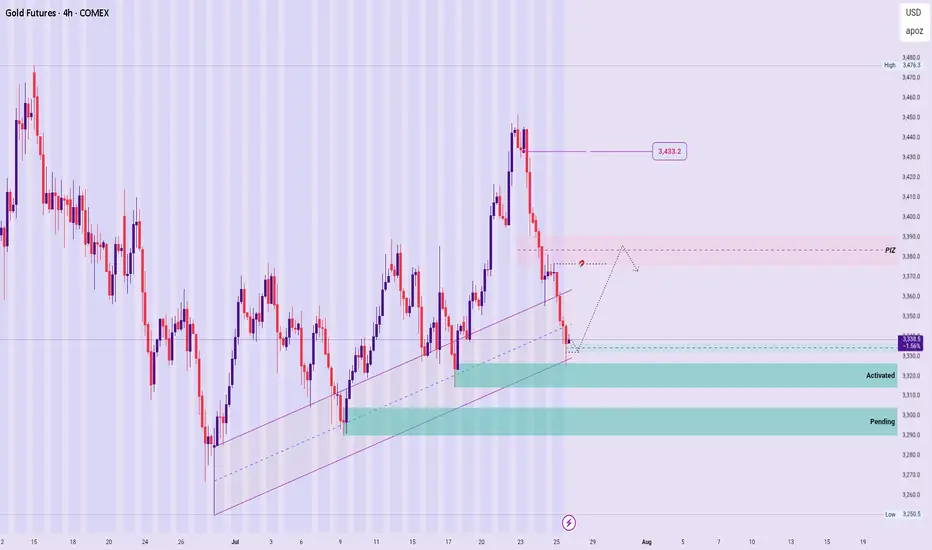
▪︎ A recently activated Rejection Zone is expected to support a gradual impulse toward the PIZ.
▪︎ From the PIZ, two scenarios unfold:
a. If it becomes a Price Base, we may see a continuation rally toward the 3433.2 region.
b. If the PIZ acts instead as a Price Cap, price may reject lower, targeting the pending Rejection Zone beneath or deeper, should the current zone fail to hold. Thereby presenting a Bearish structural formation.
Summary:
The directional bias remains bullish unless a clear Structure Breach (SB) occurs below key support levels.
Stay adaptive, and observe the PIZ reaction closely for directional confirmation.
🛑 Disclaimer:
This is not a trade signal. These are high-level technical insights meant for educational and analytical purposes. Always validate with your system and trade with discipline and risk awareness.
GD1! trade ideas
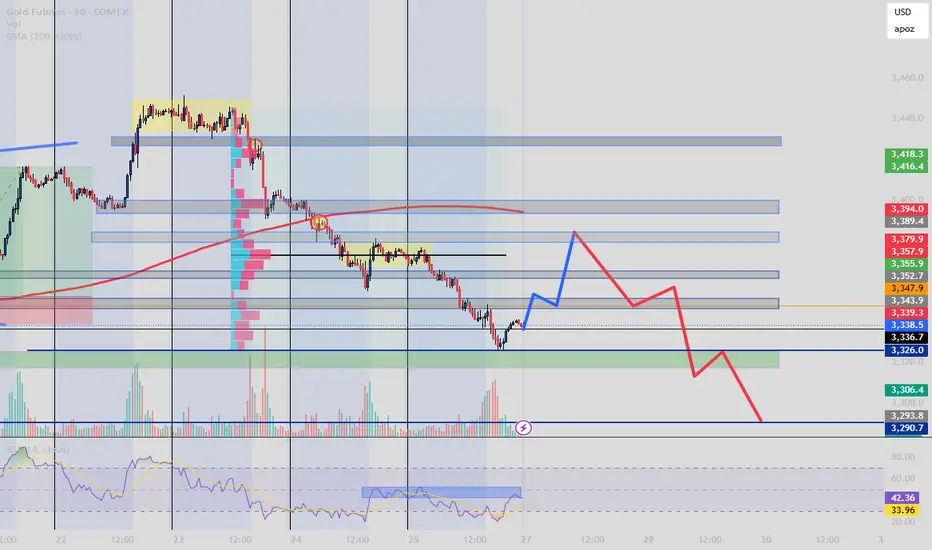
Gold Futures and the BOS Brearish Movement Steps In?After a clear break of structure and consistent rejection below the 209 EMA, price is retracing toward a key zone of confluence between 3347–3379.
This area aligns with:
Former demand turned supply (OB)
Volume cluster (high activity zone)
RSI hidden bearish divergence
Fair Value Gap (inefficiency fill target)
My expectation: a short-term bullish correction (blue) into that zone, followed by a high-probability sell-off (red) toward 3306–3290.
Bias : Bearish unless price reclaims 3394+
Strategy: Smart Money + Volume Profile + RSI Confirmation
Follow @GoldenZoneFX For more content and valuable insights.
Is GC1! GOLD At A Turning Point - Idea On Short DirectionProbably Gold is not going to be cheaper in the near future but we have seen some points that hold in the past break recently...
This is a view on the Gold chart that is explanatory by itself.
Probably tracing some support horizontally under the price at key level with the idea of, if it break follow the trend in short direction side...
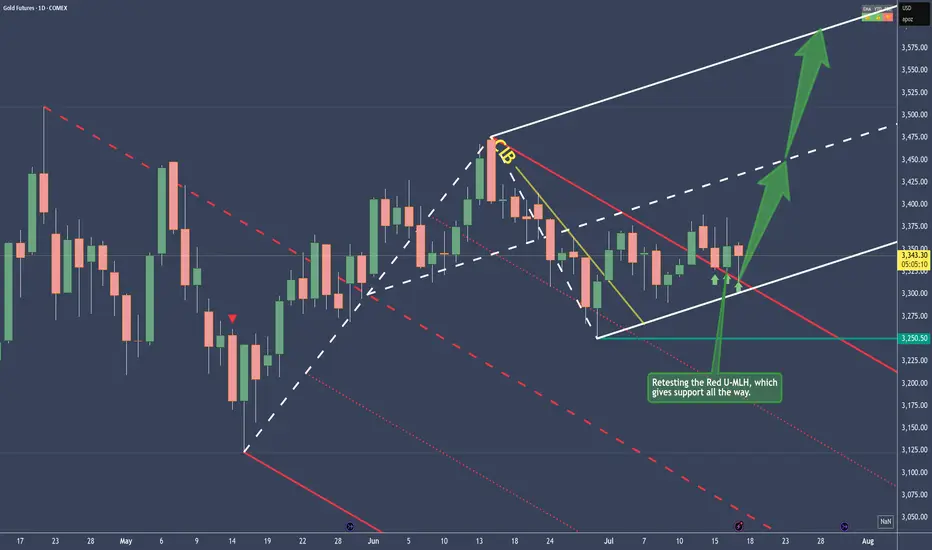
Gold - Bullish and here's whyPrice traveled within the Red Fork, until it broke the CIB Line, which is indicating a Change In Behavior.
From there on, sideways action, until the break of the Red U-MLH happened.
After the close above the Red U-MLH, price has tested it the 3rd time now. At the time of writing, the Bar looks like a PinBar. So it has good sepparation from the bottom, or a long Down-Wick. That's indicates good strenght.
To me this looks like a good long trade, but as everytime, play it save and don't let greed eat your brain ;-)
Gold Futures Update – 0.5 Fib Stop Hit, Eyes on 0.618 ConfluenceGold Futures Update – 0.5 Fib Stop Hit, Eyes on 0.618 Confluence
Our initial long setup at the 0.5 Fibonacci retracement level has been stopped out, but the structure remains constructive.
Price is now approaching a key confluence zone at $3,336 , where:
The 0.618 fib retracement from the recent swing low to high aligns perfectly,
The ascending trendline support (respected multiple times since May) intersects, and
The oint of Control (POC) from the visible volume profile shows dominant volume transacted.
This area represents a high-probability support level where bulls may attempt to defend again. We’re monitoring for reaction and potential entry signals around this level. A break below would invalidate the rising wedge structure and shift bias toward lower fib extensions.
GOLD BULLISHHello,
Here's the gold analysis:
Gold will have started an upward trend with a good probability of 80%.

Gold Futures (GC1!) Long Setup – 0.5 Fib Bounce🟡 Gold Futures (GC1!) Long Setup – 0.5 Fib Bounce
After nailing the long from the bottom and perfectly shorting the top, we’re stepping back in for another calculated move.
📉 Price pulled back to the 0.5 Fibonacci retracement, aligning perfectly with the upward trendline support and a key HVN on the Volume Profile.
📈 Entered long at 3,365 with a tight stop below 3,354 (0.3% risk), targeting the descending trendline near 3,444 for a clean 7.7R setup.
🧠 Context:
Price reacted hard at resistance, but volume support and structure still lean bullish.
Clear invalidation if we break trend and lose 3,350 support cluster.
Let’s see if this bounce gets legs. 🚀
The Edge Of The Fork - The Joker In Your PocketWOW!
\ \ First of all, I want to say THANK YOU for all the boosts, follows, and comments. You guys & gals give me the energy to continue this journey with you.\ \
Today, I want to show you that what we’ve learned with horizontal lines can also be applied to "Medianlines," or Forks.
Listen, I don’t want you to blow your brain with all the rules.
Not at the beginning of this journey, and not later on either.
Don’t ask yourself:
* when to use which Fork
* which swing to measure
* when to trade
* where to set your stop
* what if... bla bla bla
That’s not fun — that’s stress.
I don’t like stress — nobody does.
So let’s just chill and have fun here.
That’s my personal reason for doing all this Trading thing. I want to have fun — the money will take care of itself, just like the destination of a trail takes care of itself, as long as I keep putting one foot in front of the other. And that’s simple, right?
So let’s do it exactly the same way.
Just simple steps, connecting some dots, and BAM! — You’re there before you even know it §8-)
\ Let’s jump to the chart:\
Today, you’ll find out why Medianlines/Forks are a cousin of the horizontal Channel — but NOT the same.
Where are they different?
Forks are different because they’re capable of projecting the most probable path of price. And that’s a HUGE difference.
Yes, you can apply the full rule set of Forks to a horizontal Channel.
But the Channel CANNOT project the most probable path of price.
I hear you, I hear you: "No one and nothing can foresee the future. How is it even possible that Forks can?"
\ Here’s why:\
There’s a thing called "Statistical Importance." And it means that if something happens very often in the same way, we have a higher chance of seeing the same behavior again in the future.
And that’s what the inventor, Allan Andrews, discovered — and he created the rules around his findings.
\ A high probability that price will move in the direction of the projected path, as long as it stays within the boundaries of the Medianlines/Fork.\
That’s the whole "magic" behind Medianlines/Forks.
And the same applies to the "Behavior of Price" within and around Medianlines. That’s really all there is to it.
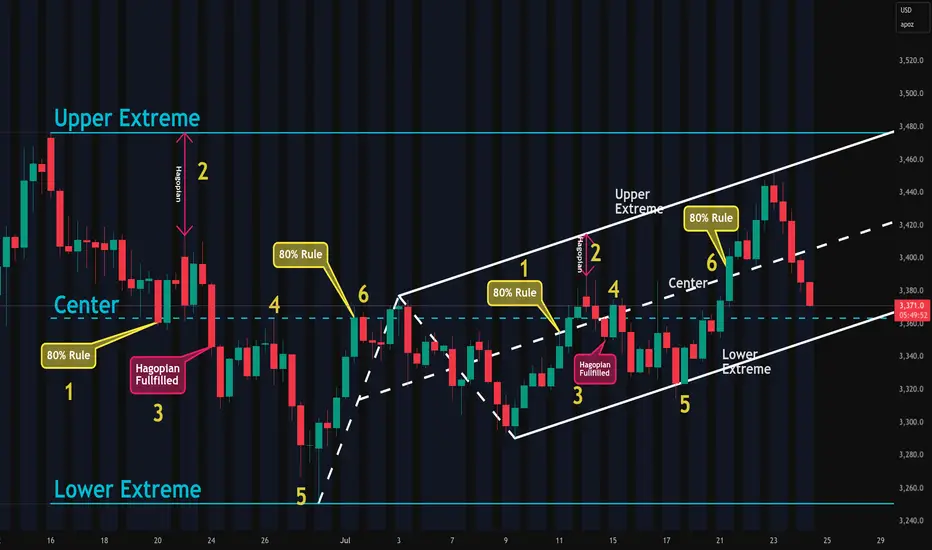
Look at the chart and compare the Channel and the Fork:
1. Price reaches the Centerline about 80% of the time
2. HAGOPIAN → price goes farther in the opposite direction than where it came from
3. HAGOPIAN’s rule fulfilled
4. Price reaches the Centerline again
5. Price reaches the other extreme
6. Price reaches the Centerline about 80% of the time
You’ll see the same behavior inside the Fork!
That’s beautiful, isn’t it? §8-)
And here’s a little Joker in your pocket — if you know the difference between the Channel and the Forks!
Do you know what it is?
Yep! You’d automatically know the direction to trade — giving you another 10% edge right out of the box — LONG TRADES ONLY. Because the Fork projects the most probable path of price to the upside, not down.
That's all folks §8-)
Like this lesson?
With a simple boost and/or a little comment, you load my Battery so I can continue my next step on the trail with you.
Thank you for spending your time with me §8-)
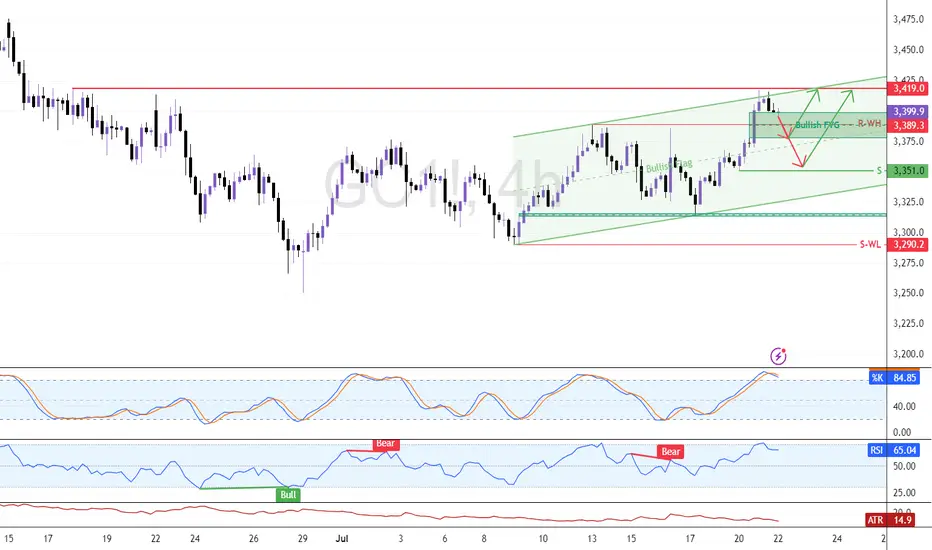
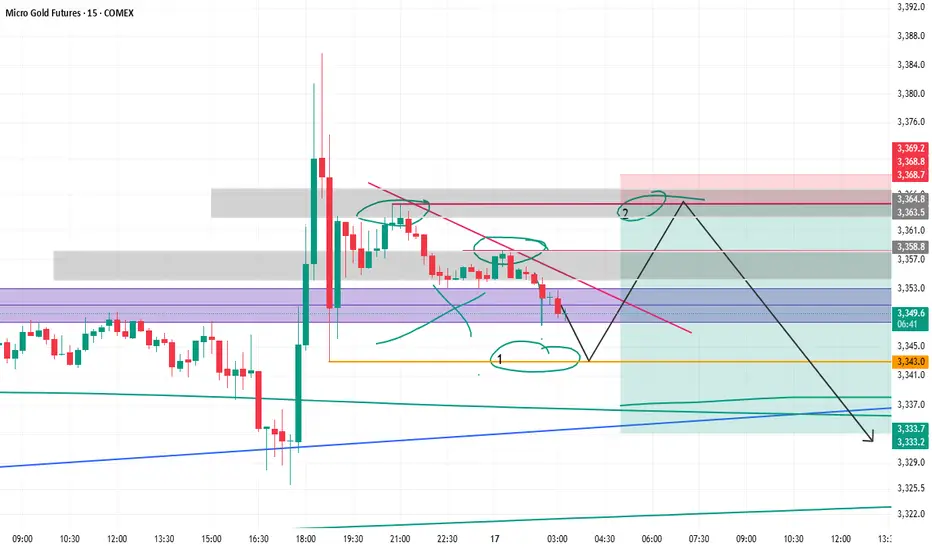
Gold Tests Bullish Zone Near $3,380.0Gold dipped from $3,451.0 and is now testing a bullish FVG near $3,380.0, supported by the 50-period SMA and anchored VWAP.
Immediate resistance sits at $3,389.0. A close and hold above this level may trigger a move back to $3,451.0. Conversely, a break below VWAP could extend the downtrend toward $3,337.0, backed by the ascending trendline.

Gold Buyers Barely Holding. Sellers Licking Their Lips.The move on gold over the last two sessions has been clean, aggressive, and very telling. Price rallied hard into a well-defined supply zone between 3452 and 3460, which has acted as a sell-side magnet for the past three rotations.
We got five separate stabs into that zone, all failing to close with strength above 3444, a key breakdown level from earlier structure. Every wick above that line was absorbed classic signs of exhaustion and seller control. That was our trigger. Once price failed to hold above 3440, the sellers unloaded. And they didn’t nibble they dumped.
What followed was a single-leg, high-momentum liquidation straight into demand at 3386–3392, wiping out all intraday longs and resetting the board. Price tagged the PDL (3386.6) to the tick, then bounced not with strength, but with stability. No strong reversal candle, no V-bottom just a hold. What that tells us is: the market’s not ready to trend yet. It’s testing intent.
Now we’re coiling between key structural levels:
- Support below: 3386 (PDL), backed by previous demand zone
- Resistance above: 3405–3410 (micro range breakdown) and 3440 (PDH)
We also have a rising trend line support running up from the July 21 low price is currently sitting right on it. That’s your structural “last chance” for bulls. Break that with volume, and the entire bullish thesis collapses short term.
My Bias Breakdown
Bullish: If we get a reclaim above 3410, then I’d target a move back to 3430, with extension toward 3444 (PDH rejection area). That’s the clean rotation if bulls can generate follow-through.
Bearish: If 3385 breaks on strong momentumbthat opens up 3355–3360, which was the last untested demand from the July 18–19 base.
Neutral (Reactive) right now. This is a trap-heavy zone. Volume is thinning out, the trendline is being tested, and both sides are probing. You don’t want to front-run here. This isn’t trend continuation yet it’s a chop filter before the next directional leg.
Key Contextual Notes
3455–3460 supply was the origin of the last two major reversals this isn’t a random level. Expect traps and stop hunts up there again if price rotates back.
3386–3392 demand has been respected across multiple sessions but it's getting tested more frequently, which means it's weakening. If it breaks clean, the unwind could accelerate.
This is a two-sided market right now. It’s not breakout season, it’s reactionary playbook time. Let the levels guide the setup, not emotion.
Trade Plan (for experienced hands only)
- Long bias: Only on 30m close above 3410 with decent volume target 3430–3444. Stop under 3385. Risk tight; momentum must confirm.
- Short bias: Rejection candle or sweep/failure at 3440–3445 OR breakdown and retest of 3385 target 3355. Invalidation on reclaim above 3410.
This is where traders get chopped to pieces, in the middle of a post-liquidation coil sitting between unfinished business above and fragile demand below. Don’t be that trader. This is where you observe, wait for intent, then strike. Trading is about timing, not guessing. Let the next move come to you. We’re ready either way.

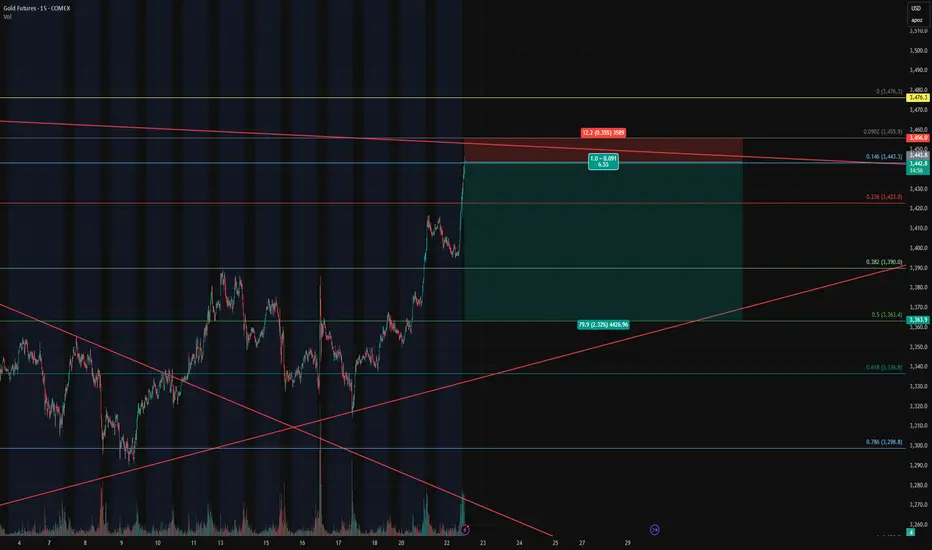
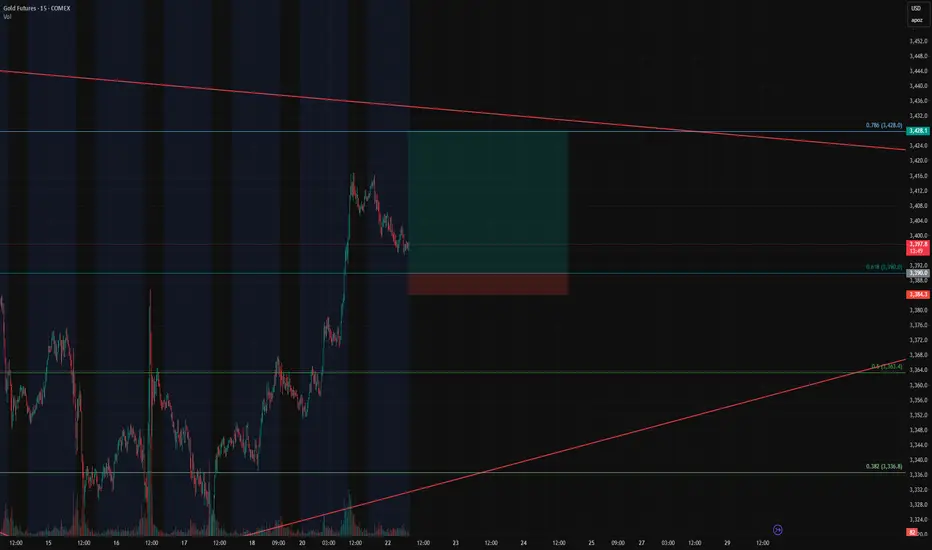
Gold Futures – Closing Longs and Flipping Short at Key Fib🔴 Gold Futures – Closing Longs and Flipping Short at Key Fib Confluence
Instrument : Gold Futures – COMEX ( COMEX:GC1! )
Timeframe : 15-Minute
New Position : Short
Entry Zone : ~3442
Target : ~3362
Stop Loss : ~3458
Risk/Reward : Approx. 6.5+
Setup Type : Reversal from Overextension / Fib Resistance
💡 Trade Recap & Strategy Shift
We’ve officially closed both our recent long entry and our larger swing long position, locking in substantial profit on this move off the 0.618 retracement.
Now, we’re flipping short based on the following:
Price reached the 0.146 Fib extension from the previous retracement leg, a level often overlooked but powerful when confluence lines up.
Trendline resistance from the upper channel has been tagged.
Momentum is showing early signs of stalling after a strong vertical push — textbook overextension.
The rally into this level lacked divergence or structural buildup, increasing the chance of a snapback.
🛠️ Short Setup Details
Entry: 3442 (after signs of exhaustion near Fib confluence)
Target: 3362 (prior structure + 0.382 retracement)
Stop Loss: 3458 (just above high / resistance zone)
Risk/Reward: 6.5:1 — excellent profile for a countertrend play.
📌 Watch For
A break below 3390 will be key confirmation of momentum shifting back down.
Failure to hold 3442 on a retest will invalidate the short and re-open the door for a squeeze higher to 3476/3480.
With trend exhaustion in sight and high confluence resistance overhead, we’re taking the opportunity to pivot short — fully aware of the volatility this region can bring.
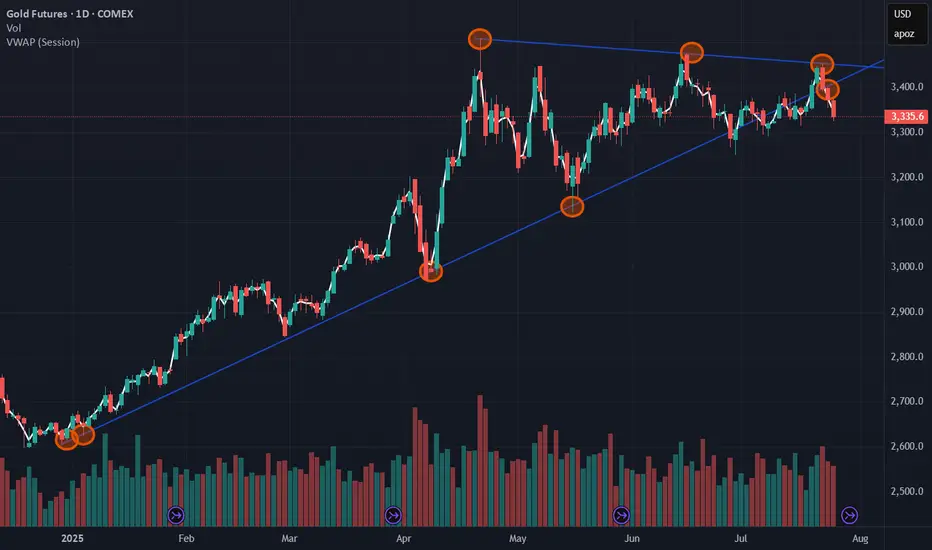
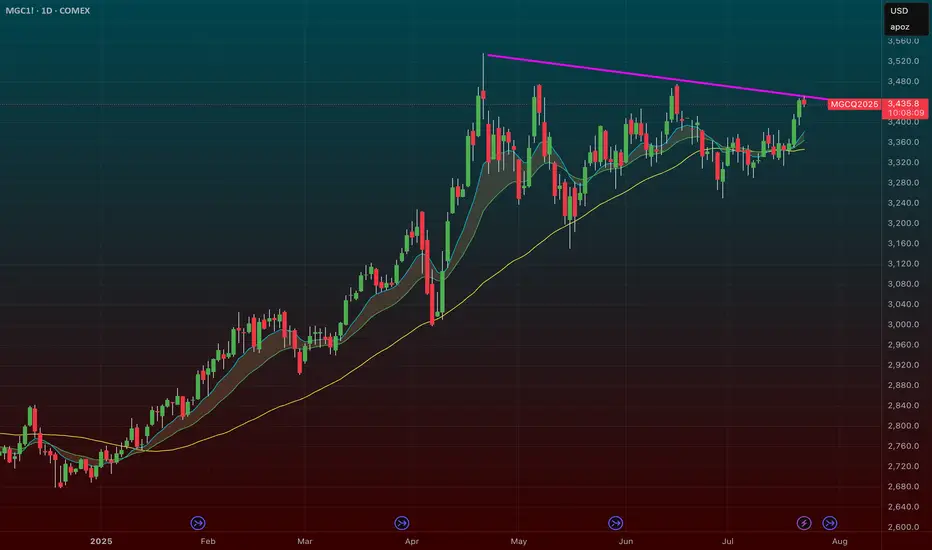
Gold to $3700 - $3800the price of gold has finally broken out of a long standing symmetrical triangle and an established 2 touch point trendline. It is currently consolidating above the broken trendline. If a 4H candle closes above the red dotted trend line we could see a massive pump up. If price closes below green upwards trendline then strategy is invalidated and reassessment needed. This is a long hold trade idea

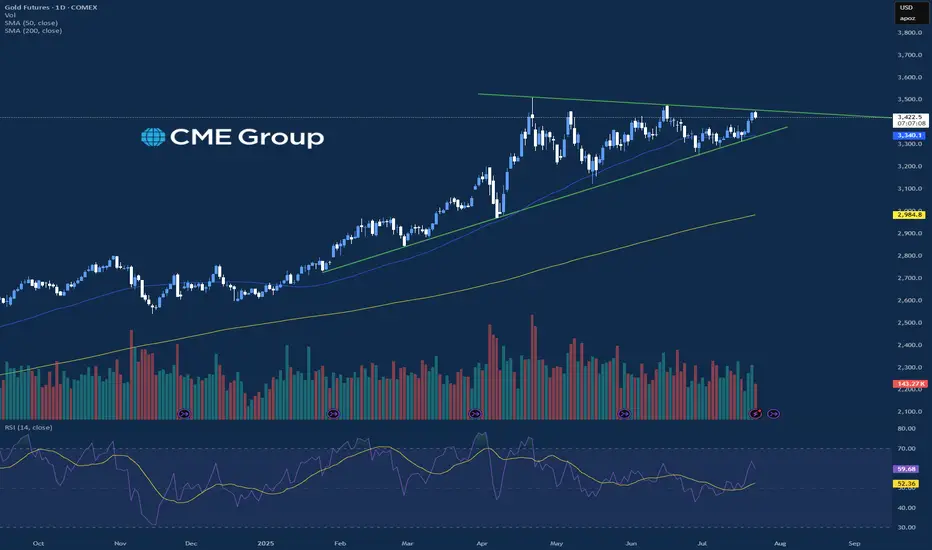
Precious Metals Pushing HigherMarkets were mixed across the board today with the precious metals leading the charge higher on the session. Gold, Silver, and Copper all traded higher again today with Copper being up near 1.5% and Gold and seeing slight gains. Copper and Silver are similar in the fact that they are more industrial metals and are affected by global manufacturing demand and overall costs more than Gold is. On July 8th, Copper saw a 13% move to the upside to a new all time high price, and Silver also made a new all time high today which brings a lot more attention to these markets.
Along with that, there is still significant tariff uncertainty that has been driving Copper and Silver higher relative to Gold. The Gold market is still moving higher overall but has stalled out slightly since the new all time high from April. Outside of the metals, there are critical earnings reports coming out tomorrow looking at Google and Tesla that may add significant volatility to the equity indices for the rest of the week.
If you have futures in your trading portfolio, you can check out on CME Group data plans available that suit your trading needs tradingview.com/cme/
*CME Group futures are not suitable for all investors and involve the risk of loss. Copyright © 2023 CME Group Inc.
**All examples in this report are hypothetical interpretations of situations and are used for explanation purposes only. The views in this report reflect solely those of the author and not necessarily those of CME Group or its affiliated institutions. This report and the information herein should not be considered investment advice or the results of actual market experience.
$GC / Gold Update - A New Entry - 7/23Hello fellow degenerates,
Our next target is above 3504 and we are currently in a quick ABC retracement.
- I am looking for an entry in the 3424.6-3411 range.
- This is a wave C so we could see an ABC or a ABCDE pattern forming.
- Levels to watch: 3433.1, 3424.6, 3416.6, 3408

$GLD / $GC – Gold Poised for Breakout as Hard Assets FlexAMEX:GLD / SET:GC – Gold Poised for Breakout as Hard Assets Flex
Gold is setting up for a major breakout, and the broader market is finally catching on to the hard asset trade. Whether it’s inflation ticking up or the never-ending government deficit spending, the market is starting to signal something big.
🔹 Macro Tailwinds:
Inflation pressures + record deficit = a perfect storm for gold.
The dollar is under pressure — metals ( AMEX:GLD , AMEX:SLV , SET:GC ) are responding.
This theme isn’t going away anytime soon.
🔹 Technical Setup:
AMEX:GLD and SET:GC (Gold Futures) are coiled tightly just under breakout levels.
Volume is steady, and momentum is building under the surface.
A move through current resistance could send this entire trade into overdrive.
🔹 My Positioning:
1️⃣ Options: Long AMEX:GLD calls with 1-month expiration — slow mover, but clean structure.
2️⃣ Futures: Trading SET:GC contracts on the breakout side.
3️⃣ Silver Exposure: Still holding partials in AMEX:SLV — it’s following gold’s lead but with more juice.
Why I’m Focused Here:
This is not a one-day theme — hard assets are becoming a rotation trade.
If this confirms, we could see multi-week upside in precious metals.
It’s rare to get clean technicals that align this well with macro.
Gold short Read this clearly, my confidence in this trade is 3 out of 10.
Use very small size on this trade, as iam not sure at all that this is even the right thing to do.
The chart is messy, and there is consolidation is going on.
if the price didnt make it to nr 1 circle, dont worry about it. The most important thing is the close below the FVG.
Also confirm on lower time frame to see how the price reacts to the entry levels. If anything is going to happen, is going to happen at those levels.
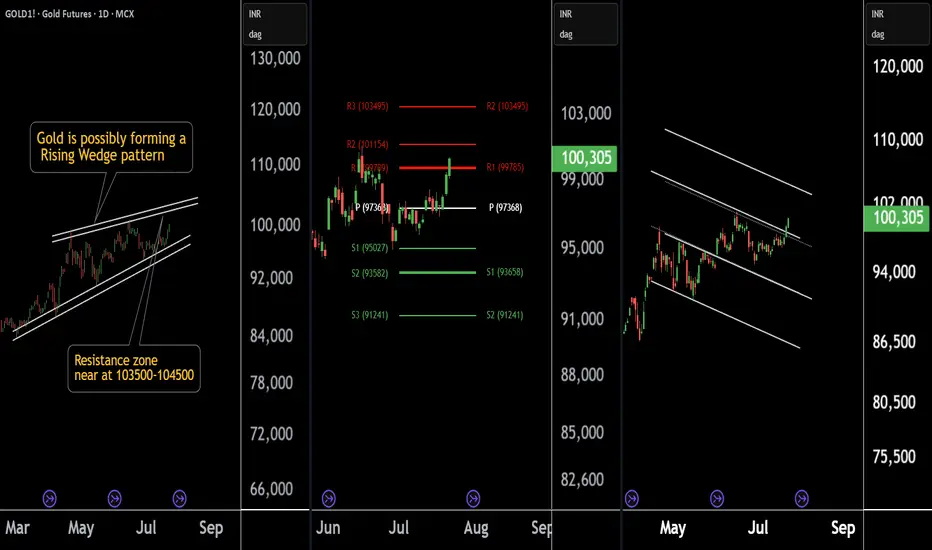
Gold at a Crossroad: Long or Short? Key Levels in FocusThere are three chart of Gold .
Gold1! is forming a Rising Wedge pattern, with resistance positioned between 103500-104000 levels.
Gold1! is facing Pivot Point resistance around the 103500 level, indicating potential supply pressure.
Gold1! is approaching the parallel channel resistance, and the upside move is nearly complete in percentage terms, with resistance around 103800-104000.
if this level sustain then we may see first of all higher prices then again fall in gold1!
Thank You !!
XAUUSD – New Week Technical Bias (Market Open)
Bias Overview:
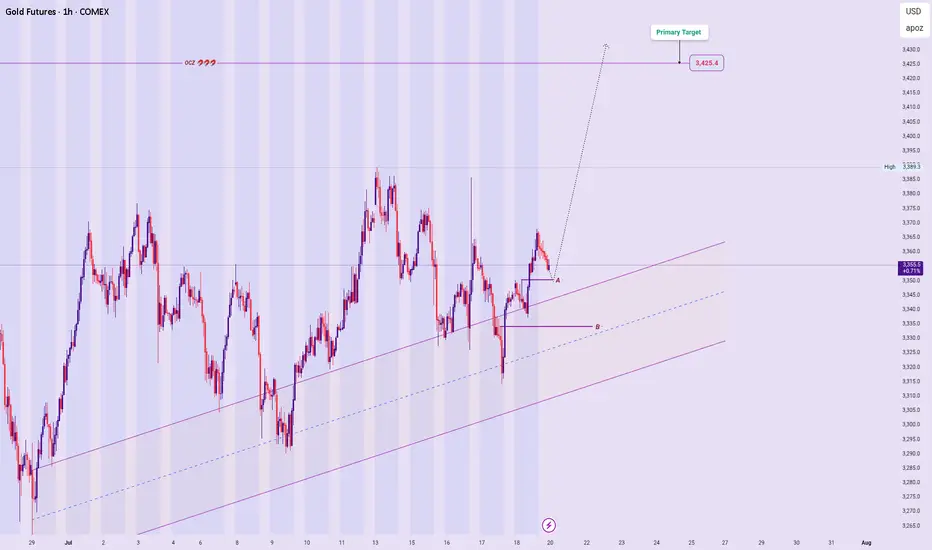
Current outlook remains aligned with previous bullish analysis, supported by the broader Ascend Sequence on higher timeframes.
Price Expectations:
Anticipating a micro decline toward Price Zone A as a potential springboard for a bullish continuation.
While less likely, a deeper pullback into Price Zone B may occur before the rally unfolds — still within acceptable structure for HTF bullish intent.
Execution:
Will rely on micro-timeframe confirmations and reaction behavior within these zones to finalize entry decisions following market open.
Invalidation will be break and bearish structure below the ascending sequence Channel.
Summary:
Maintaining bullish bias while awaiting refined entry opportunities at defined price zones. Structural invalidation remains below key support and Sequence Line levels.
[b ]🔒 Disclaimer:
This analysis is for educational and strategic insight purposes only. It is not financial advice. Always manage your own risk and confirm with your personal trading plan before executing trades.
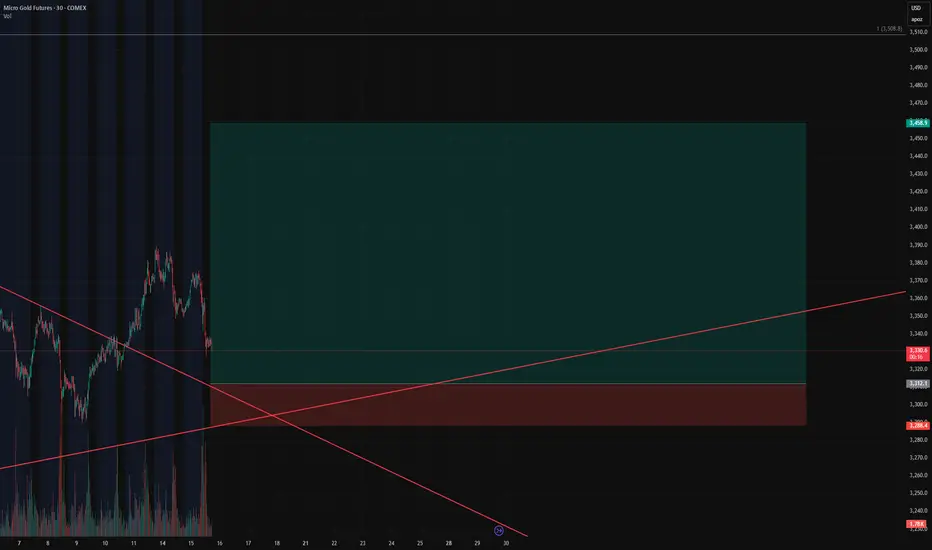
Gold Bulls Loading Up – Our Short Squeeze Trigger is Set!🚨 Gold Bulls Loading Up – Our Short Squeeze Trigger is Set!
We’re flipping the script on COMEX_MINI:MGC1! After a prolonged downtrend and textbook wedge compression, our breakout long is LIVE – but not without trapping the late shorts first.
💥 Entry: $3,312.1
🛑 Stop: $3,288.4
🎯 Target: $3,458.9
🧮 Risk/Reward: 6.19
Price just bounced at the retest of the wedge apex, and volume is confirming the move. If this holds, we’re riding momentum all the way up – and letting short pressure fuel the breakout.
📈 Trendline breached.
⏳ Time compression converging.
⚠️ If you’re still short, watch your stops!
GOLD BULISHHello, I hope you are well today. Gold will likely rise. I advise you to buy into your positions.
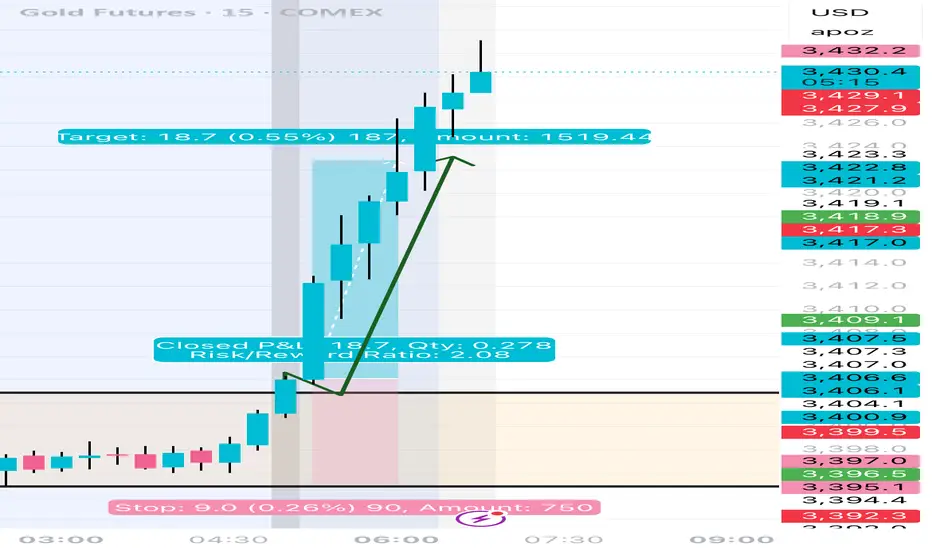
Gold Futures Long Setup – Breakout Continuation off the 0.618 FiGold Futures Long Setup – Breakout Continuation off the 0.618 Fib
Instrument: Gold Futures – COMEX ( COMEX:GC1! )
Timeframe: 15-Minute
Trade Type: Long – Breakout Continuation
Entry Zone: 3390 (0.618 Fibonacci retracement)
Take Profit: 3428 (0.786 Fib)
Stop Loss: 3384
Risk/Reward Ratio: 6.68
Setup: Bullish Flag on Retest
🔍 Trade Thesis
This trade is part of an ongoing breakout continuation strategy we've been trading, and now we're eyeing a pullback entry as price returns to a key retracement level.
Price nearly exploded through the 0.618 Fibonacci level (3390) during the prior breakout.
Now it's pulling back in a textbook bullish flag formation, suggesting healthy consolidation before the next leg.
The 0.618 retracement is aligning with previous intraday structure and trendline support — making this an ideal level to scale in.
This is a high R:R continuation play, with targets set at the 0.786 Fib level (3428) — right before macro resistance kicks in.
🎯 Entry & Exit Strategy
Entry: As price touches 3390 or forms bullish confirmation at the level.
Stop Loss: 3384 – tight and below key fib/flag structure.
Target: 3428 – based on 0.786 Fib extension and breakout continuation projection.
📊 Why This Works
Breakout behavior: Price respected the breakout impulse and retraced cleanly into a bull flag.
Fib confluence: 0.618 pullbacks are a classic entry in trending markets.
R/R of 6.68: Excellent reward profile vs. limited risk.
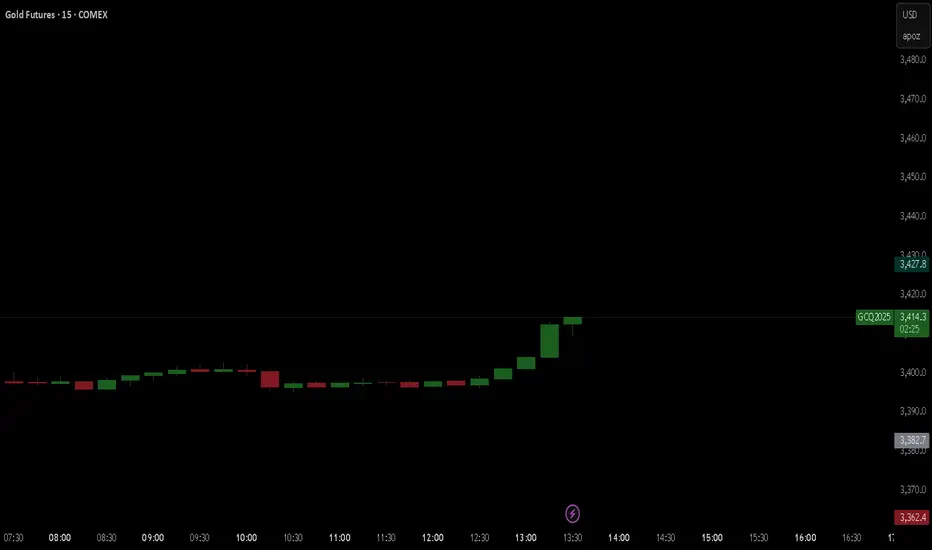
Eye These Levels to Go Long On GoldFenzoFx—Gold remains bullish but eased at $3,419.0 resistance. The Stochastic at 85.0 suggests a pullback may follow. Traders can watch support at $3,389.0 for short-term scalping.
Swing entries may emerge near $3,351.0 if bullish signals appear, such as candlestick patterns, structure breaks, or fair value gaps. Updates will follow if price reacts to these levels.