MMK. It completes the neck-shoulders, entry 30.00MMK. It completes the neck-shoulders pattern with an entry in the region of 30.0 with a target of 37.42.
MAGN trade ideas

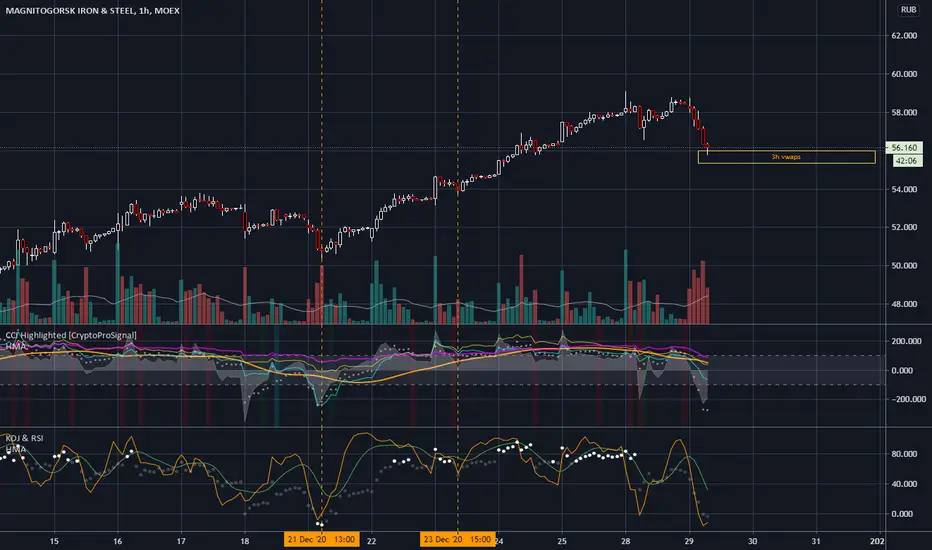
MAGN - Setting up for advance in Q4 MAGN had a nice run since Oct22 advancing +157% since the bottom to recent Sep's top. Is the rally over, or do we have at least one more advance potential? My technical thesis supports the latter.
I don't have high confidence in my ElliotWave count on this chart, due to price extensions beyond classical fibonacci levels, but from pure price and volume dynamics, one may suggest that price is in a base building process for at least one more advance to 59-61 area and even above it.
Having a closer look on a Weekly chart, we may notice big green accumulation bars and good weekly bar closes during price advance and relatively low selling volume when price corrects. Notice how price gets supported every time it moves bellow this line - all that are signs of buyers proliferation and accumulation happening.
For the confirmation of my thesis, I need price to stay above previous low (49) and decisively move above 53.5 pivot with volume support. That would put me into the game with tight stop-parameters. If the price will dive bellow 49 area, than my short/mid-term bullish thesis is wrong and price needs more time to digest its advance (if not something major bearish is in the cards for Russian equities).
P.S. orange straight lines are my previous buy (bellow the bars) and sells points (above). Double bar above means complete exit from the position.

long position on MAGNMy strtegy is based on price action with the reading of certain indicators that I like whilerespecting all the values that define the stock maket

MAGNRUSSIA STOCK
The price retest on the Trendline with stong candle (bullish engulfing).
We have completed harmonic with wait high probability to advantage next harmonic.
For more details contact me.
don´t forget like and support.I will be gratful👨💻.

go up evry wher i told magn volume grouth up and go back take liquidity and take 50% the rang so we can see another point 78% target

Forecast of financial results for Q4`21 - an upside of 20%We calculate financial indicators for the 4th quarter of 2021
Revenue — $3163.3 million (3278*965)
EBITDA — $1250.2 million (3278*381.4)
Profit - $911M (1250-125)*(1-0.19)
Change in NCF - $125 decrease based on 12% of revenue (1643-3163.3*0.12*4)
FCF — $875.2 mln 92% qoq increase (EBITDA-change in PFC-CAPEX-taxes = 1250.2+125-286-214)
Dividend - 5.7 rubles. an increase of 214% qoq (875.2*73/11174.33) received more than the target of 4.5 rubles. that means there will be other regular expenses with an increase in CPAEX by $200 million.

MMK: Stock price will repeat the 2nd quarterAgainst the backdrop of strong fin. indicators of the 3rd quarter
Key factors and catalysts
Annual forward dividend approximate to 40% in H2 2021
Should significantly increase production up to 30%
Cost less than competitors in one sector on P/E and EV/EBITDA multiples
Beneficiary of commodity supercycle 2021
Most likely going to be included in the MSCI Russia index
The desire of the main shareholder to increase free-float by 2%, which gives an increase in FIF by 0.5 and weight in the MSCI index
Main beneficiary from the transition from duties to MET tax from the beginning of 2022
Main beneficiary from the decline in world prices for iron ore and high prices for hot-rolled steel
Negative debt load
Making every effort to be ESG friendly
An unprecedented openness and disclosure of information to investors
It is a super clear and transparent business with a double-digit dividend history
We calculate financial indicators for the 3rd quarter of 2021
Revenue - $ 3302.6 million to increase by 1.5% q / q (3370 * 980)
EBITDA - $ 1,380.7 million decrease by 3.8% q/q including the effect of duties $ 60 million (3,370 * 427.5-60000)
Profit - $ 1017 million (1380.7-125) * (1-0.19)
Total NWC - a decrease by $ 259 million due to a significant decrease in world prices for iron ore and a decrease in prices for finished products due to the introduction of temporary duties on inventories (1425 * (0.4 * 0.33 + 0.20 * 0.25))
FCF - $ 1,045 million, an increase of 92% q/q (EBITDA-Change in PSC-CAPEX-Taxes = 1380.7 + 259-350-245)
Dividend - $0.11. an increase of 222% taking into account compensation over a cappex ((1045 + 350-175) / 11174.33) or 9.4% in quarter

Magnitogorsk Iron & SteelLike the look of this MOEX name as it breaks out to multi-month highs. Possible pullback to the 50-EMA before continuing it's upward trend.
Will look update levels on confirmation on trade.
For more offshore insights and ideas, get in touch today.
Last: 73.20


MAGNITOGORSK IRON & STEEL Course Hey guys, MAGNITOGORSK IRON & STEEL is in a great historical moment we are going to witness a new high in its history. It is in a bullish push with low buying volume, then high early trading volume to confirm the rise and a hammer candle shape. On the TIMEFRME M1 we see a kind of hammer candle with a purchase volume feedback issued, it goes towards the top for a new test of the equilibrium zone. Big possibility of breaking out the price at the same time the zone to access another and go for a new historical high.
Then go to the top of the equilbre zone for test and breakout with thereafter a symbolic number of 59,000 to go test the top of the bullish channel.
Please LIKE & FOLLOW, thank you!


