RTS IndexCurrently RTS index is testing the resistance around 920. The resistance level is strong and RTS will consolidate below this level. RTS has been in major consolidation since 2011 and now the spring will be compressing, preparing for a major decline. Targets are mentioned on chart.
More likely the third target will play out in this scenario, which means around 75% decline from current levels.
Cancellation of this scenario will be in case of fixation above 1240.
DYOR
NFA
RTSI trade ideas

I See further upside to RTS (Russian Stock Index)If 1340 pivot would be passed ATR could go up and we can see 1400 on RTS. Oil is bouncing from key technical level MOEX:RTSI

The 2023 master plan is pretty clearThere will be an overwhelming amount of events happening in H2'23:
- A crash in Treasuries (10Y above 10%)
- A crash in EURUSD (0.75 is waiting)
- A totally unexpected move in USDJPY to 100
- A crash in SPX below 1500
- A crash in RTS to 250..300
- A silent withdrawal of financing of Ukraine by US and EU
- Peace talks RU <> UA on Russian's terms

9 years = 4000%RTS now is young child before grow and jump of teenager
Russia have all resourses may be in world
only one country and all resourses.... big volume resourses

Dimensions of market horrorsJust comparing the size of market drops for illustration purposes... Definitely this one is not the biggest... Definitely greater one is in future...

RTSI - possibly greater downfall ?Against the background of the expectations of tougher sanctions together with the absence of obvious peaceful ways to resolve the problem with Russian war of aggression, plus the structural degradation of the economy and "SME" business defaults and export embargo, here it comes an understanding is coming of a probably deeper slide for RTSI. Forecasting is a thankless task anyway.

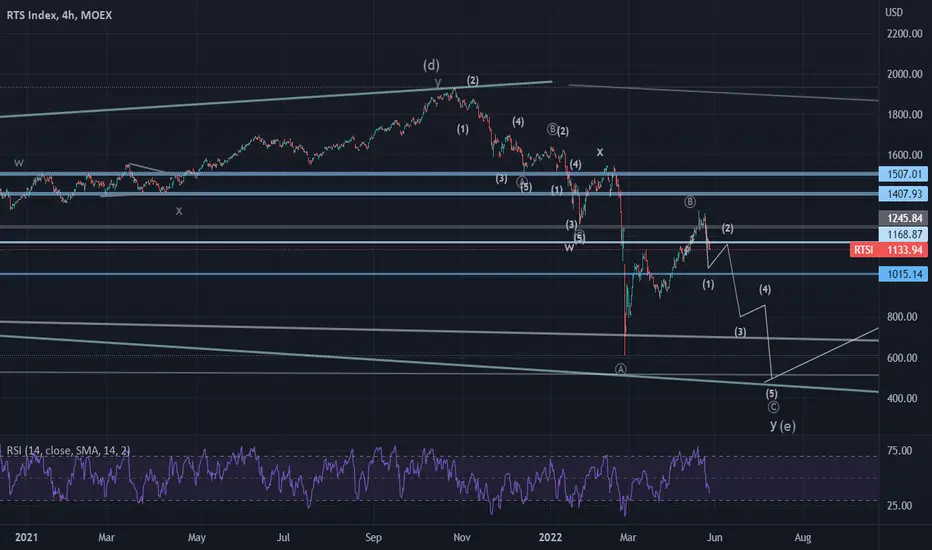
1050 should be reached before the crash resumesA new minor high is due in the next couple of weeks. The Russian market will be lifted by the last bullish wave worldwide. Then the downtrend will resume.
7 months to form 1-2-1-2, means at least another 7 months to hit the low. It's not about Russia: the crash will be a worldwide affair. It will be destructive, will take its time to make the markets suffer, and the recovery won't be easy. The entire 2023 will be just bad across the globe.

Negative scenario on rts index with deep crab patternsThere are 2 variants both lead to very low values.
But one of them lets ~30% grows first.

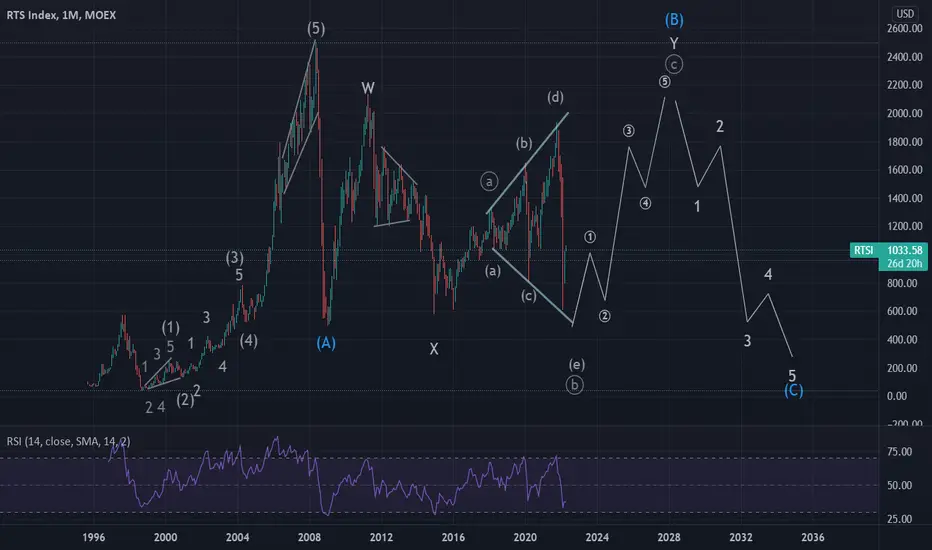
A long-term view at the Russian marketOne can predict the outcome of the recent pickle in Ukraine just by comparing where we stand in terms of growth cycles in US vs Russia.

RTS INDEX shown figure "Head and Sholders"The exit of non-residents is announced for 08.08, so it may show the "Head and Shoulders" pattern.

RTSI will revisit 200..300 one last time in the 21st century.The bigger question is what's going to happen next.

Russia - RTS$ Index - Does this suggest War will go end? Does this suggest War will go end?
A multi-year triangle gives us a clue.
Triangles are one of the most recognizable patterns in the Elliott Wave Principle. As with all wave patterns, they occur at every time scale and the large-degree triangles are especially interesting because they often contain a notable socionomic element.
Large-degree triangles in rallies are bear markets. Sideways movement in nominal terms means that, with consumer price inflation generally positive, in real terms, market value is being lost. Large-degree triangles during stock market rallies are manifestations of a negative social mood. It’s not surprising, therefore, that the ends of triangles often correspond with a news event of a social action that has been driven by this negative mood.
The chart above shows the Russian Trading System Index. This is a free-float capitalization-weighted index of 50 Russian stocks traded on the Moscow Exchange, calculated in U.S. dollars. As such, it takes into account the performance of the Russian ruble as well as the stock market. Since 2008, the index appears to have traced out a multi-year triangle, with the final wave ((E)) down now in operation.
Notice that it was towards the end of the decline in wave ((C)) of the triangle that Russia made its first incursion into Ukraine in August 2014, escalating it further in November of that year.
Fast forward to 2022, and with over 190,000 Russian troops in on Ukraine, another incursion happened. Nevertheless, Russian President Putin states that he has no intention to invade other European countries.
Given the Elliott wave pattern, and what appears to be the waxing anger of the final wave lower in social mood, we take those statements with a bucket-full of salt. This sociometer is anticipating that a dramatic social action it's coming to an end?

RTSI target @ 1678 Weekly and monthly RTSI index chart are quite fascinating to study. This time was the third time it bottoms and bounces from the major top from 1997.
RTSI short term target @ 1678
Long term, headed towards new ATH.
MOEX:RTSI
MOEX:RTSI

RTSI UpdateMy interpretation is that the Russian Stock market has restarted its descend to new lows. Lots of people feel relieved and optimistic today argueing that the market will continue going up despite geopolitics. I looked at the recent advance (propelled by abrupt ruble strengthening) as a bounce. As technically the count has not been completed and there was no divergence on RSI.
If some form of embargo is a trigger the market can take a deep dive and stay at lower levels for a while.
Russian Market AnalysisA couple of scenarios. One assumes another meltdown as soon as in the next few weeks. The alternative is that the bottom is already in place.

Russian Market Close Up A closer view of the Russian Market. The triangle is notional and can turn out to be a wxy combination. However, since there was no triangle spotted on the way down so far there is a fair chance we will have it here near the bottom. Given the bigger picture posted previously the chance to load Russian stocks will come somewhere in May or maybe later during the summer.

Russian Market Long-term ViewThe Russian market picture is getting clearer with the latest abrupt decline. There is a chance that in the coming years we will see 400%+ growth. As to from when exactly and what stocks to buy - I will cover separately. Stay in touch.
Suffice to say that in an expanding triangle we could expect wave e to travel beyond the a-c-e trendline, hence the sell-off is not yet complete.
RTST Index Not legal and financial advice;
Any information provided here is only the personal opinion of the author.

Putin, Geopolitics and the RTSRTS was getting hammered at -13% when I made this. Definitely going to be interesting to track. More blood to come, no pun intended.


Every instrument is assuming a pre-crash positionMonday is likely the last day before the crash resumes.
Nothing major ever happens on Thu and Fri that follow the FED meeting, but the week after can easily delivery something funny. The Chinese NY is slowing things down as well, so maybe one more week of idle.
RTS needs to make one minor swing high, ~1450. Then a downside of 1000 points is due.
The correction in VIX is extremely mature: the stars continue to align for a never-seen-before market event. The unwind of the 50-year long carry trade in the Dollar (short the Dollar, buy Bonds and Stocks) will reach its apogee.
The 2022 will surely make it into history books.


RTS - short in 2022RTS is finishing wave a of larger E of the triangle. Trough should be expected sometimes in June-Sept later this year. Short term is bullish in wave b of E.
