Why you can lose your investments on SBER So technically we have the same picture like Alibaba - WXY
PUSRPOSE IS 68 rub
WHY WILL WE HAVE SO TOUGH FALL:
1) Short position denial
2) non-residents have no ability to sell
3) WE HAVE 1 TRILLION FOR BUYING STOCKS AND WE STILL DIDN'T SEE THAT MONEY IN THE DEPTH OF MARKET( FNB doesn't want to buy at these levels )
4)Traders are not fools and they are gonna make a lot of limit positions i guess
Make a screen if i'm gonna be right don't tell me that i didn't warned you :)
- If like my analysis subscribe and make a comment bellow about that stock
SBER trade ideas

Symmetrical Triangle in Downtrend (Bearish) SBER In my opinion, there is a very small probability that the price will reach 140, but such a phenomenon is quite possible as a false breakdown. Classic textbook triangle. The price jump was caused by the purchase of the product by the Ministry of Finance of Russia, there is an assumption that interest in this instrument will fall.


Going down till mid-2023 in wave C.The idea is that SBER in a long correction phase (ABC pattern). Would we await a C-wave as an extension? - It would be a worst scenario.

SBER Bank Forecast Sberbank ✅
$SBER
There are now two scenarios, but the ultimate goal is to reach 160-180 rubles. The purple scenario has a higher probability than the green and blue scenarios. This year, we will witness such figures. As we reach 160-180 rubles, there will be a correction. After that, you'll need to keep an eye on price level of 100-120 rubles.
(This is not an investment advice.)
#investment #russia #russiaukraine #russianfederation #banking #markets #stocks #equities #emergingmarkets #financialmarkets #economy #banks

SBER TODAY IS A GOOD DAY TO RENFORCE YOUR POSITIONGOOD MORNING,
after the uptrend, in the last two days, today is a good day to confirm your position as a buyer although the red candle today because it's just a "feint" so keep quiet if there is a surprise I will tell
check my profile the last 10 analyses in the daily frame are all correct
check it
GOOD LUCK


Hull MA & Warning Zones & Buy/Sell Arrows | BacktestA backtest for laptevmaxim92's script "Hull MA & Warning Zones & Buy/Sell Arrows".

SBER analysisprobability 1: 33,3%
probability 2: 33,3%
probability 3: 33,3%
wait for the break.
next analysis (Wednesday)


SBER goes downVIX is going up, RI1! and IMOEX are in a downtrend and sber is the wearest bank according to the graph.
All info on the chart
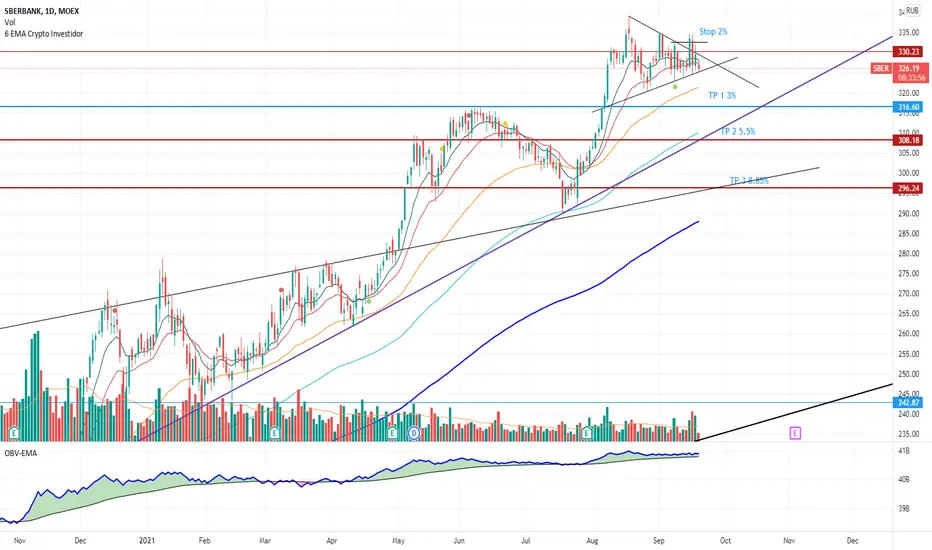
Sberbank: Expected Entry PointsExpected entry points and psychological round numbers on daily chart.

SBER - bearish trap is still an optionI published that idea before all the market went awry, I was lucky to participate in the sharp decline. But know I see the initial coverage is still valid. All the move down can be considered as bearish trap and I will go long if I see the paper snaps back into the wedge to break higher.

SBER wedge breakupI will short SBER the only way. I want to see some strength at the open, fade in 30 mins, some action at the low. In this case only I am going to participate in a falling knife action.


SBER D1: the attempt to enter bearish is dated on these TH-FRForecast made with Timing Solution software

SBER - revising my countA closer look at SBER forced me to revise my count - I now consider it has topped in wave v of larger 3. Expect to see a bottom mid 2022 somewhere in 200 zone. This makes me think Russian indexes may show final push to new high in June (countwise oil should bottom somewhere in 60 zone soon and make a final rally above the recent high which may trigger rally in Russian oil stocks) however I believe all rallies will be sold. Don't recommend to trade wave 4, better to wait for the bottom next year.

SBER trading plan for 2021SBER is down targeting 270 zone by mid July then up to 340-360 into 4q2021.

Traditional|SBER|LongLong SBER
Activation of the transaction only when the blue zone is fixed/broken.
The author recommends the use of anchoring fixed the blue zone, this variation is less risky.
If there is increased volatility in the market and the price is held for more than 2-3 minutes behind the activation zone after the breakdown, then the activation of the idea occurs at the prices behind the activation zone.
The idea is to work out the resistance level .
* Possible closing of a trade before reaching the take/stop zone. The author can close the deal for subjective reasons, this does not completely cancel the idea and is not a call to the same action, you can continue working out the idea according to your data, but without the support of the author.
+ Maybe right now we will go even lower, then it's okay, the idea is not activated and simply canceled.
+ ! - zone highlighted by the ellipse is a zone of increased resistance, in this area there is a possible reversal for a correction, please take this factor into account in this transaction.
The "forecast" tool is used for more noticeable display of % (for the place of the usual % scale) of the price change, I do not put the date and time of the transaction, only %.
Blue zones - activation zones.
Green zones - take zones.
Red zone - stop zone.
Working out the stop when the price returns to the level after activation + fixing in the red zone.
Orange arrow - the direction of take.
The red arrow - the direction of the stop.
SUM PNL: This parameter displays the total % of all closed ideas of the "new" format (according to the author) for this sector at the time of publication of the idea. The calculation is very "clumsy" just the sum of the profits of all the ideas, based on this indicator, you can more accurately assess the risks when working with my ideas of this sector. I present you the construction of the idea, you can use it yourself as you like based on your subjective view and risks, the calculation of the PNL indicator is carried out only on transactions that the author closed on TV in manual mode or by take.
P.S Please use RM (risk management) and MM (money management) if you decide to use my ideas, there will always be unprofitable ideas, this will definitely happen, the goal of the system is that there will be more profitable ideas at a distance.

Analyse The market is on the rise but it is heading towards a very strong resistance and it is in an equilibrium zone, we will not take any position for the moment. If he manages to break through the 294.53 level, we could buy with a 90% chance of winning.
Le marché est à la hausse mais il se dirige vers une très forte résistance de plus c'est dans une zone d'équilibre, nous ne prendrons aucune position pour le moment. S'il parvient à franchir le niveau 294,53, nous pourrions acheter avec une probabilité de 90% de gagner.
