RVNBTC trade ideas

RVN/BTC topped exactly on target, now? RavenCoin support zonesRVN topped exactly as plotted in this Idea (click) .
It has pulled back sharply but may be near support.
Plotted here are 2 zones to look for possible bounce.
340-345 sats might bounce but is looking unlikely.
334-336 sats is the Ideal zone to start next leg up.
320 sats is Bull's Last Stand before downtrend resumes.
.
See some of my other plots and trade calls below.
I also plot Forex and Stocks, take a look at my profile page .
Currently in Play:
LTC bottom at $65?
Alt Extinction Event?
Recent Achievements:
RVN temp top 415 (perfect Target, saved profits)
ADA breakout (PERFECT targets, massive profits)
BTC to 14k call (Near Perfect target, easy trade)
BTC bottom 3.1k (caught the EXACT bottom)
LINK re-entry (caught the spike)
LTC to $150 call (near perfect plot)
MATIC top Warning (caught the EXACT top)
NEO Rocket Launch (great entry, massive profits)
ETH breakout (instant Profits, no drawdown)
MATIC rocket (massive Profits, breakout entry)
ZRX breakout (massive Profits, short wait)
XLM breakout (massive Profits, instant Win)
FET top warning (EXACTLY on time)
DASH top warning (EXACTLY on time)
Of course, I have had total FAILS on some ideas too, not going to pretend.
But all of my plots show PRECISE entries, TIGHT stops, and EXACT targets.
Precision is the way of the Fib. Almost every turn happens at a Fib Line.
.

when to enter RVN BTC BinanceI would set 2 alarms Moving Average Exponential (9, close) Crossing Up Moving Average Exponential (21, close) on RVNBTC, 1D. bullish. and set alarm for for RSI above 56.90. to enter.


$RVN Lookin Juicy Ravencoin looks to have broken it's downtrend and is currently retesting this trend break as support. Very burrish.


$RVN, ~350sats support level showing some signals of hodling $RVN
Looking at ~350sats support level showing some signals of hodling here.
RSI & MACD bullish divergences on the 2H chart
Volume still at high levels in Binance (+350 last 24hs)
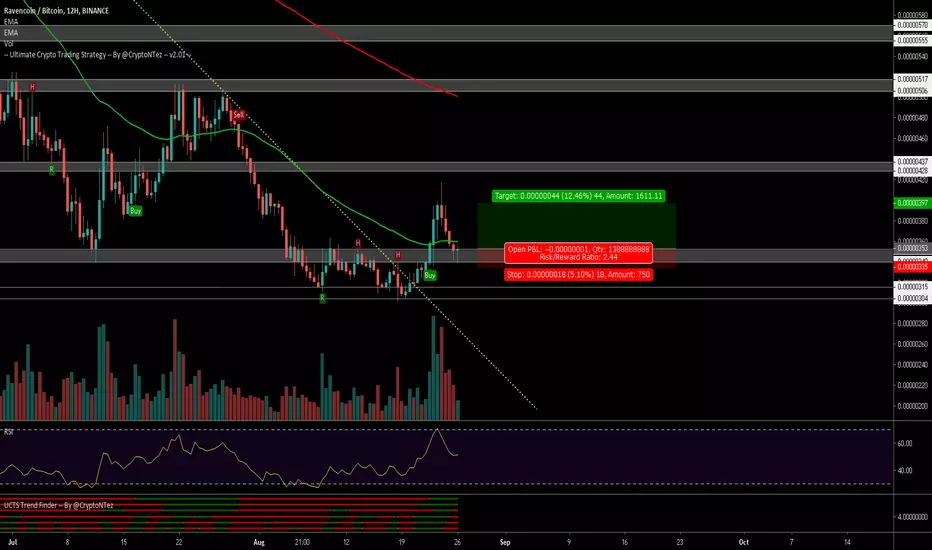
UCTS Buy signal still active on the 12H chart
Aiming for a bounce to 400sats as 1st target
#RVN

RVNThird attempt at breaking the 12hr kumo + the 12hr 90MA
Broken out of the descending wedge, decent volume, historically strong support (check my tweet for a broader view of the chart before the binance listing days - twitter.com )
Sold position around 390, buyback + more around 350

BIRDS FLY FOR A REASON!!!!!!!!Okay Ravencoin is like the dead bird that will be the phoenix rising from the ashes. We've already seen it come back to life, we have just yet to see it fly. No reason to think it won't, it's a fucking bird. We flying to the moon.
15% or bust

RVN/BTC headed 414-417 sats for bounce? Raven move near a top?Raven coin has been on the move with eager bounce.
Quick plot here that indicates a possible interim Top.
Reaction at blue Band 4 and possible dip will be telling.
We could be entering a Buy-The-Dip era for RVN here.
Retrace from Band 4 to 2 (2.618 or 2.236) is common.
Maximum bullish retrace would be to the 1.236, no lower.
.
See some of my other plots and trade calls below.
I also plot Forex and Stocks, take a look at my profile page .
Recent Achievements:
BTC to 14k call
BTC bottom 3.1k (caught the EXACT bottom)
LINK re-entry (caught the spike)
LTC to $150 call (near perfect plot)
MATIC top Warning (caught the EXACT top)
NEO Rocket Launch (great entry, massive profits)
ETH breakout (instant Profits, no drawdown)
MATIC rocket (massive Profits, breakout entry)
ZRX breakout (massive Profits, short wait)
XLM breakout (massive Profits, instant Win)
ADA breakout (PERFECT targets, massive profits)
FET top warning (EXACTLY on time)
DASH top warning (EXACTLY on time)
Of course, I have had total FAILS on some ideas too, not going to pretend.
But all of my plots show PRECISE entries, TIGHT stops, and EXACT targets.
Precision is the way of the Fib. Almost every turn happens at a Fib Line.
.

$RVN, Trying to flips current range where it has been bouncing $RVN
Trying to flips current range where it has been bouncing for the last weeks
MACD bullish divergence
UCTS Buy signal on the 12H
Above 400BTC volume in Binance
Crossed over descending trendline
If we see confirmation / cross over EMA 50 aiming for targets ~430/500sats
#RVN


Raven/Bitcoin (Aug 23) #RVN $RVN #BTC $BTCAccumulate : 330-350
Sell : 400-470
Mid-Hold : 510
Stop : Under 330

$RVN - Huge Buy Volumes The coin has broken through the descending and horizontal resistances. The price is testing the resistance of the descending channel with huge buy volumes, probability of breakout is 78%. I would advise you to buy a part for the market price and a part for a market price and a part a little bit lower in the orange rectangle.


RVNRVN / BTC
Exchange : #BINANCE
Target 1 : 360
Target 2 : 385
Target 3 : 420
Stop loss zone : 310 ~ 305

RVN consolidatingRVN has seen volume reduce while consolidating. Wait for a breakout into the blue box. Wait for it to test diagonal support (S/R flip) and boom. Easy 10-30% gain. Be patient

RVN/BTC (1D)Bullish wedge is forming. I see a possible movement to the lower border and forming a bullish divergience before we come out. Lets see Zones of interest and targets are on the chart. Good luck!
