Long RVNWell with the looks of it, It's retesting the Broken Wedge. Good time to long here.
Mid term targets are in green!! Lets see where it goes
RVNBTC trade ideas

Ravencoin (RVNBTC) Bounces On Strong Support, Where To Next?Ravencoin (RVNBTC) found support at the 0.786 Fib. retracement level of the last bullish wave. This support level also coincides with MA200 and EMA200.
Ravencoin can bounce here and move up before any further correction.
For additional bullish action, it would be a good signal to close above EMA10 (0.00000715) and see additional volume. We will have another bullish wave soon.
Feel free to hit like to show some support.
Namaste.

$RVN,Potential double bottom on support with increasing volume..$RVN Very similar setup to many other coins that we reviewed today...
Potential double bottom on support with increasing volume...
Both RSI & MACD rising and showing divergences
If you are not into accumulation of #RVN, wait for a break through resistance//flip into support.


Ravencoin continues uptrend - 4HHello dear traders.
I see some bullish signs for RVNBTC pair :
1) it started the uptrend after breaking above the purple trendline with confirming volume .
2) broke above EMA(50) in the daily chart by 15%.
3) in 4H chart, Healthy RSI which is in an uptrend and above 50.
4) in the daily chart, RSI looking great. Broke above 50 and resistant trendline.
5) MACD lines above 0 and trending up .
Only bearish thing is Divergence in MACD’s Histogram .
Thank you. Happy trading.


RVN Adam & Eve double bottomRVN/BTC looks to me like it's about to complete an Adam and Eve double bottom.
Definition (from stocks): thepatternsite.com
Nice volume coming in. Conservative entry would be after confirmation, or on seeing what pattern it forms after confirmation.
#notfinancialadvice


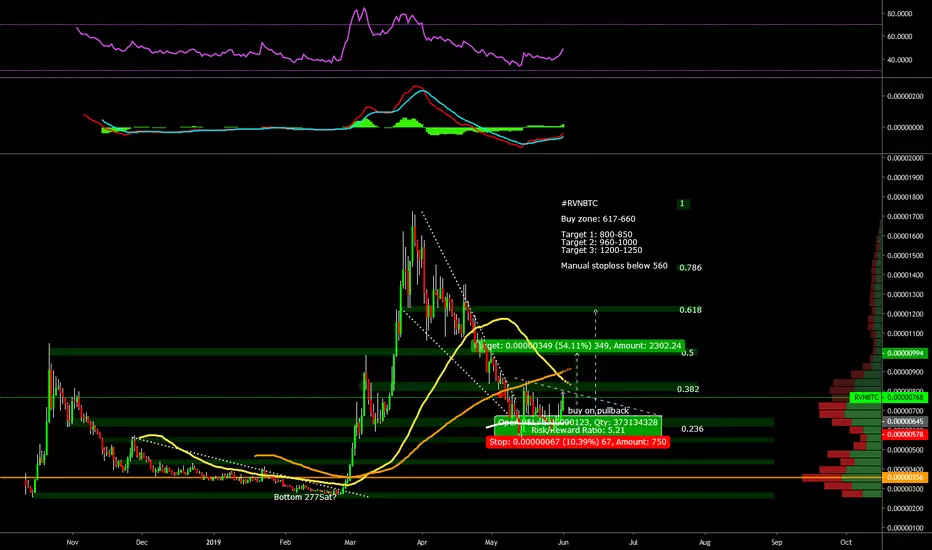
Raven long#RVNBTC
Buy zone: 617-660
Target 1: 800-850
Target 2: 960-1000
Target 3: 1200-1250
Manual stoploss below 560

Buying RavenCoin RVNBTC#rvnbtc
700 - 725 Buy Zone
819-840 Target 1 : 18%
960-1000 Target 2 : 41%
1060-1160 Target 3 : 60%
all price in satoshi
stop loss below 580

RVN LONG$RVN
Looking good, cleared that white box resistance I mentioned in my prior analysis, longs looking good. Currently consolidating beneath the POC (highest volume node), so we could see a pullback to white box.
Targets now are R2, R3 once we break yellow to the upside.


RVN Ready for BULLHi guys!Rvn is ready for bull run.You can see the possible targets in that chart.
That is not financial advice!Have a nice trade guys!


RVN upward trend We got our Eagle crossing yesterday on the 4 hour and RVN zipped up to the 200 , whats next ?

Raven coin about to make supernova explosion. Very bullishHi everyone,
raven is a crazy coin of the binance .
we know it was rising with non stop but in 2 month it has been falling non stop
it is in a falling wedge
it is in also in a strong pennant
Be careful, it is in the wedge of the fallilng wedge and penant.
Hey it is not ended
Look at fibonacci retracement it has bounced 0.786 level
By these infos, raven coin is very very bullish
We will see what happen.
if you have an idea, feel free to comment your idea.
Loves
Muikka

RVN finishing the retrace RVN has pulled back to the .786 and bounced off and now might test again
* There is an impulse wave down and we are in wave 5
* If we break below the .786 then it could head down to the 1.00 retrace
* If we hold above the .786 then we will be heading back up to retest the top

RVN ABOUT TO BREAKOUT?BINANCE:RVNBTC
Placing order at that EQ of that Order BLock (595) for potential 50% gain
Stop at 555 (6% loss)
Enter with small position because of large SL

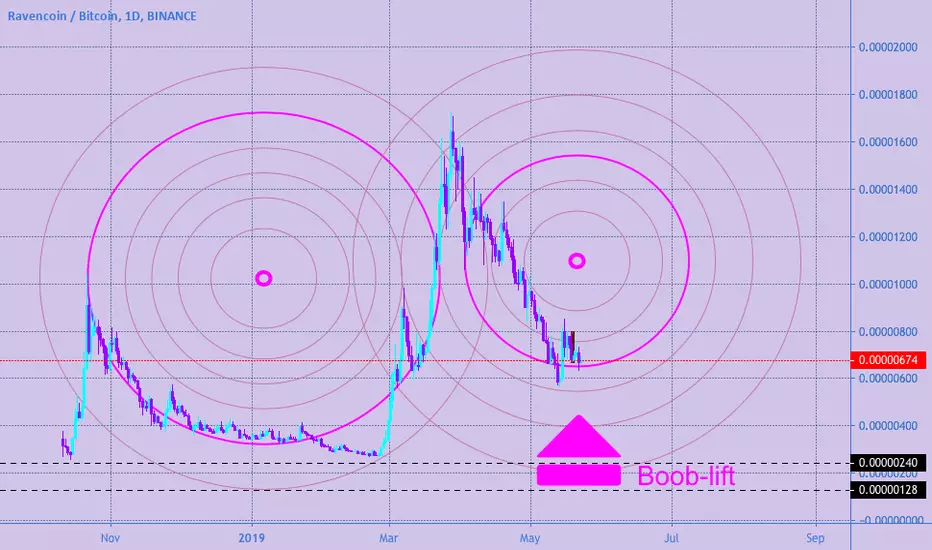
RVN/BTC may not have bottomed yet: Raven to hit 448 sats? Raven fans surely noticed (rejoiced?) the recent spike.
That spike confirmed the Fib series this coin was born with.
But the retrace has been sloppy, hinting of possible lower low.
560 may well have been the bottom, not ruling that out.
741 will be the next "tell" depending the reaction there.
448 would be a "hodl" buy with say 50% of allotted capital.
.
See some of my other plots and trade calls below.
I also plot Forex and Stocks, take a look at my profile page .
Currently in Play:
BNB Re-Entry zones
MATIC Re-Entry zones
ZRX Break Out watch
NANO Impulse Redux
LINK Re-Entry zones
Recent Achievements:
NEO Rocket Launch (great entry, massive profits)
BTC path to 10k (in Progress, perfect turns)
BTC bottom 3.1k (caught the EXACT bottom)
ETH breakout (instant Profits, no drawdown)
MATIC rocket (massive Profits, breakout entry)
ZRX breakout (massive Profits, short wait)
XLM breakout (massive Profits, instant Win)
ADA breakout (PERFECT targets, massive profits)
DASH top (Top warning EXACTLY in time)
ONT top (Early warning for Top)
Of course, I have had total FAILS on some ideas too, not going to pretend.
But all of my plots show PRECISE entries, TIGHT stops, and EXACT targets.
Precision is the way of the Fib. Almost every turn happens at a Fib Line.
.
