RVNBTC trade ideas


$RVN - We have a BUNCH of Reasons to BUYThe coin looks very juicy from the technical side. There we can see a convergence on RSI on the majority time-frames. Double bottom ob the 1D chart and on the 4H chart. Moreover, the price fixed above the strong horizontal levels. And by the end - oversold according to the Stoch. RSI data.
If you found this idea interesting, do not forget to Like it and subscribe to the profile, so as not to miss our updates!


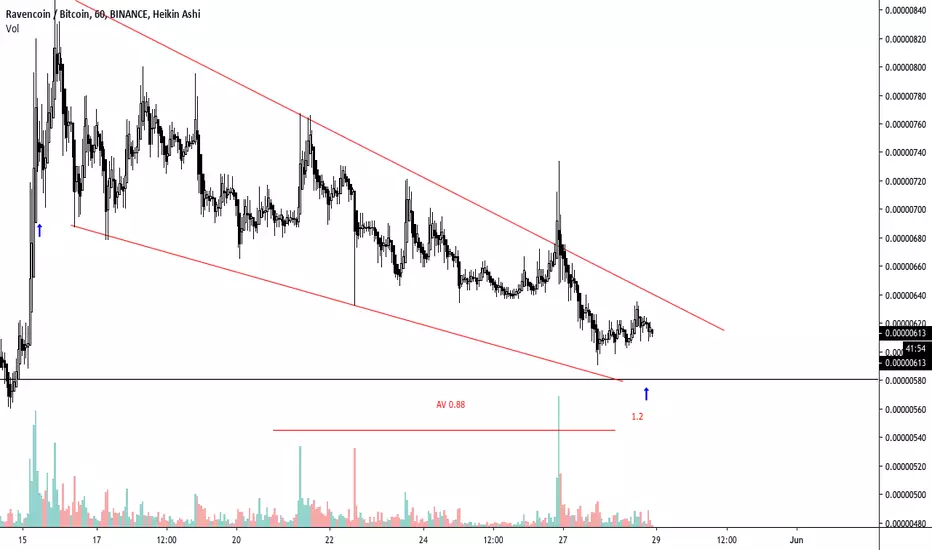
$RVN Sitting at support around 600sats..$RVN Sitting at support around 600sats..
UCTS still on a sell signal on the daily
For now volume looks low
We are looking for Volume & a break over 750sats to start thinking about it...
Accumulating at this range could be an option but be careful about what BTC will do
#RVN

Binance, RVN/BTC, what i see for RVN buy zoneReversal Zone: 598-565,
Demand: 445-486,
Bearish: 276-386


HEHEHOHO Looks like a good buy zone but a head and shoulders is forming
I don't recommend buying yet or setting strict stops because the trend is still bearish
I want to buckle my seatbelt and prepare for launch but patience is key. As said by Bitcoin enthusiast Warren Buffet "Haste is the enemy of accuracy" :D
Happy Trading Everyone!

RVN/BTC SHORT OPPORTUNITY...DONT BUY MORE THAN 10% OF YOUR CAPITAL !!!...
AND ALWAYS RESPECT THE STOPLOSS...
IF YOU LIKE THE CHART PLZ GIVE A LIKE!! ;-)
IF THERE IS ANY CHANGE I WILL UPDATE THIS POST!
====================================================================================
BUY: 723
STOP: 650
TARGETS: IN CHART
====================================================================================

RVN reached bottom - next cycle happening?RVN reached 0.236 fib and bounced hard to 0.382. Next cycle should start here.


Binance, RVN/BTC, will history be repeated?Buy on Reversal: 629-596,
Dump: 265-313,
Target: 993, 1164, 1410, 1718, 2314


Ravencoin (RVN) fancies the fibs - Reversal possibleAfter an incredible run of more than 500% between Feb 24 and Mar 27, Ravencoin (RVN) has cooled off considerably. But once we're sure the top is in, we have a good chance to get the fib layout right. Switch to 2hr chart, click on the Fib Retracement tool and plot your lines from the lowest point, to the highest point. This sets up our fib lines. From a personal standpoint, I prefer very lightly drawn fibs. Not need to clutter your chart.
If we look at price action against the fib levels, we can see it respects the fibs quite often. The most interesting is how strong the reversals were off the 0.786 have been. Look at points 0, 1, and 2. You can see the reversals off 0.786 fib level has yielded really strong returns. This is proving to be a strong level of support. We are approaching this same level, so let's look at three scenarios.
Scenario 1 (red; neutral/short)
Falls through the 0.786 fib. This will be the fourth test of the 0.786 level. The more times a support or resistance level is tested, there is an increasing chance it will no longer hold the line. If this happens, look for slow movement down towards the 1.0 fib level, where the price has spent a considerable amount of time at, before the pump started in February. In this scenario, set an alert for when the price crosses upward around 350 sat, indicating a possible reversal off the 1.0 fib level has occurred. Then check the chart again and look for an entry point, with a possible sell around 0.786. Remember, if we loose support, it becomes a line of resistance.
Scenario 2 (purple; neutral/long)
Looking at other coins with similar runs with big gains and then giving it all back, quite often they will flatten out along the strongest level of support before making another run. If this plays out, it's a neutral play. Set an alert just above and below the 0.786 fib level (example: crosses down 515; crosses up 630) and wait. When alert triggers, reassess to see what direction it's going. If it's going up, look for an entry, with an exit before the 0.618 fib level. Look for a minimum of 10% gains. If it's going down, short and look for small gains as it approaches the 1.0 fib level.
Scenario 3 (green; long)
If price action respects the 0.786 fib again, look for a strong reversal and go long once reversal is confirmed. First sell target somewhere before 0.618 fib level around 750 sat, and second sell target before the 0.5 fib level around 930 sat.
***
Don't be greedy. Take profit when it's time, be confident with your decision, and smile.

RVN - Golden ration FIb Support holding strongThe Golden ration fib support @ 673 needs to hold for more upside movement

Rvn LongRvn just completed the third wave and also completed a break out and currently retesting, longing this level could be interesting.


