RVNBTC trade ideas

RVN - New Harmonic - Bearish ButterflyBearish Butterfly harmonic setup
AB:XA = ~78.6%
BC:AB = ~50.0%
AD:XA (projected) = ~127.2%
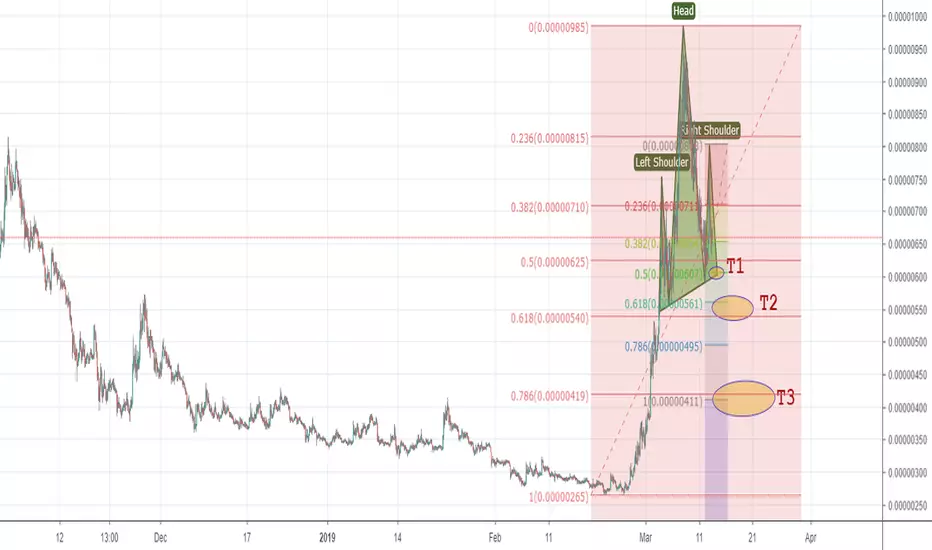
Anticipating a break to the downside near the 127.2% RT
Three realistic targets plotted at the 38.2%, 50.0%, and 61.8% of entire structure.

Expect #Ravencoin $RVN to find support between 1045 and 985 satThe RSI and volume indicate that there should be a little bit of a consolidation period ahead. The fundamentals surrounding Ravencoin are some of the most bullish in crypto. Take a look at the number of organizations developing securities on the platform here:
www.reddit.com
The recent move is likely a result of Ravencoin's close association with tZERO and the MOU for up to $100MM by Makara and GSR . Both are highly successful VC companies in Tech, now entering the FinTech space.
The next target following a demonstration of support between at the 50% retrace and cloud support of 610 Sats can take the price all the way to 1430 Sats . Positive news from the Overstock.com OSTK conference call regarding tZERO and other Medici Ventures and their utilization of the Ravencoin (RVN) protocol to create securities may be moving the price at the moment:
Excerpt from Overstock.com , Inc. ( OSTK ) CEO Patrick Byrne on Q4 2018 Results - Earnings Call Transcript
seekingalpha.com
"Patrick, I want you talk to the next slide on Ravencoin.
Patrick Byrne
Thank you. Ravencoin is an open-source project towards which Medici Ventures has been especially supportive by contributing labor and mining. The mining of this coin has spread faster than any coin in history. It's 14 months old, the community is very active. We've been supportive of this open-source movement. And although we only own a single-digit percentage of the coins, -- of Ravencoin, it's not just the value of the coins that we find attractive, it is the elegance and robustness of the Raven protocol for digital assets going forward.
Next, Raven has a role to play in a number of these Medici companies. It's been designed and developed as the perfect protocol for digital assets, has significant advantages over both Bitcoin and Ethereum . I think, you'll be hearing very significant news about Ravencoin shortly, perhaps as early as this week. It plays a role in the number of the companies in which we're involved, like you're seeing in front of you here. If you know the business model of consensus, one could say that Medici Ventures is like has a similar business model but where consensus is purist about using ether, we are not purist about using Ravencoin but there are four or five companies in there, at least, that look like they will be making use of Ravencoin."
The hash power on the Ravencoin network has risen in recent weeks by 120%. The price and hash power will have to go much higher to provide the necessary security level to use it as a platform for listing high-valuation securities. It is a great platform to list private company securities as well as gaming tokens.

RVNBTCRVNBTC
Entonnoir : W/D/H4 (swing)
La nouvelle fenêtre de tir en daily vient de s'ouvrir comme prévu avec la cassure des ~985. Je vais maintenant attendre la prochaine sortie de compression H4 pour rentrer à l'achat.
—————
Funnel : W/D/H4 (swing)
New trading opportunity is on after we broke the ~985 as per suspected in my previous TA. Now, I'll wait the next compression breakout on H4 to go long.
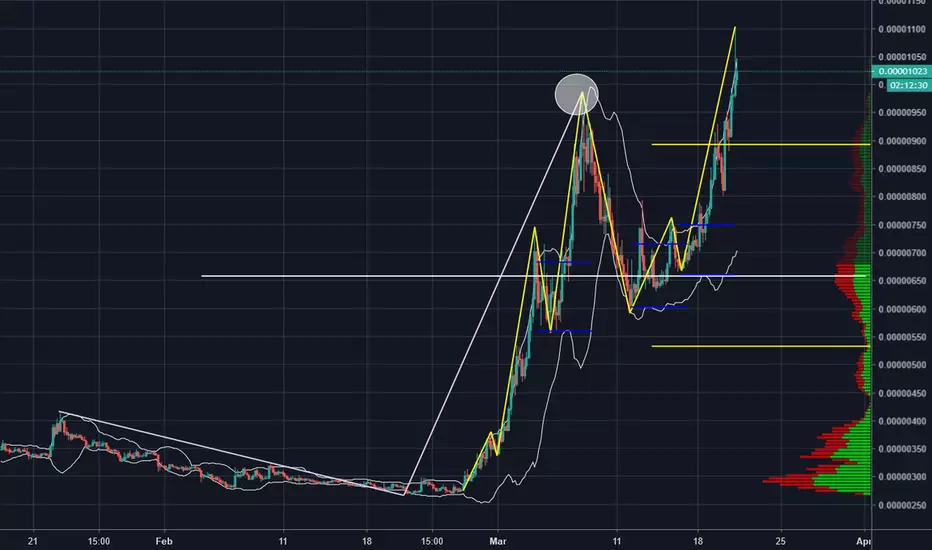
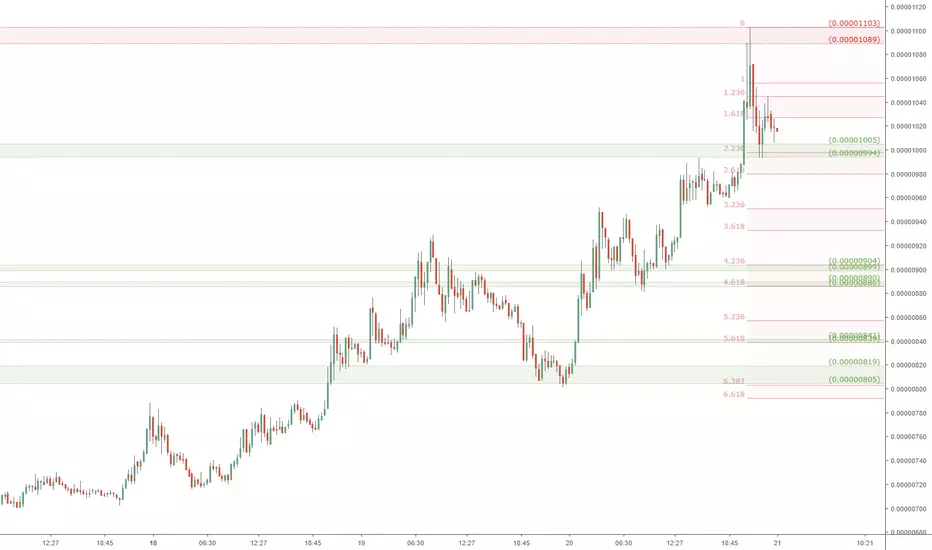
RVN/BTC retrace watch: Raven Coin topping? re-buy zonesWow, what a flight by Raven: outperforming most others.
But, all good things must come to an end soner or later.
Now, it looks like it might have topped at a Fib Confluence.
So I am plotting support zones to watch if it retraces.
Picking 'the' top is risky and it may make a higher high yet.
Thus I am not shorting, but have sold most of my bags for now.
We may well be at a support now, but not much safe room to climb.
So unless already holding longs from below, this is not a good buy rn.
If it breaks the high and retests, then maybe a 'fomo' buy to consider.
900 sats seems like a pretty good buy.
840 sats would be the Ideal long entry.
800 sats could be Bulls' Last Stand.
.
RVN/BTC HUGE HEAD AND SHOULDERS 107% profitgood luck my friends
donations welcome
CARDANO wallet
DdzFFzCqrhsfVU1GuAXEF9WReccYzwEzUYnYtfLVhEgJLrwSruQGQJHTrAUE7Bnb4ZLmEX8A1YczwLQMYxFGkqzabchaD1rvqKVRFZ4f

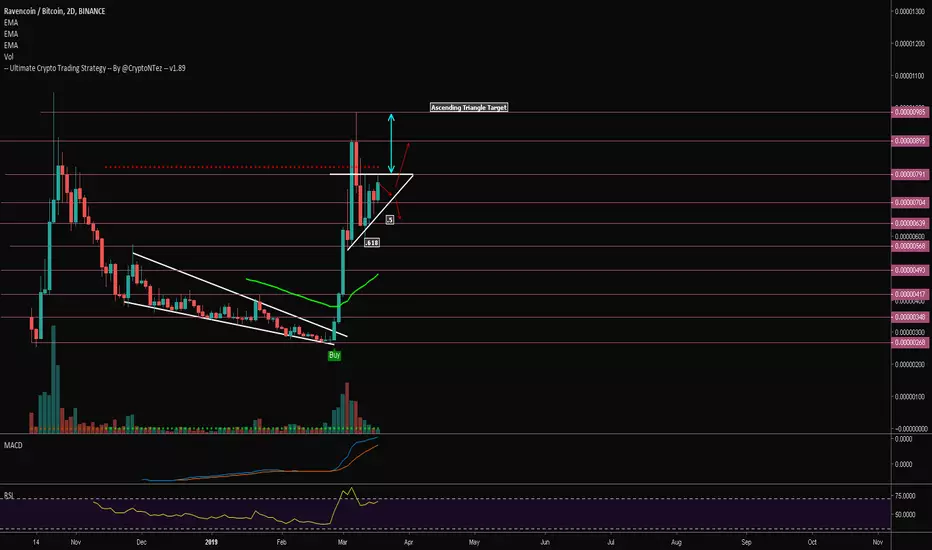
$RVN, Potential ascending triangle in play
UCTS Buy signal active (126% if you never sold from bottom...)
Retrace completed around .618 Fib level and from there we went up again.
RSI starting to rise and MACD about to bullcross.
Volume still low but restarting...
#RVN
RVNBTCSee chart. Idea. This is my viewpoint and my opinion. I am not giving advice but only sharing what I see.
Potential Harmonic Plot for RVN - New to HarmonicsYes, this is neutral, I'm plotting points that don't exist yet.
Neutral until point C is confirmed at the .886 RT
Pink trend lines show confluence for the 1.618 RT from point A-D pivot point
3 targets placed with fib plotted for reasons why (.382 for minor RT, .618 golden zone RT, 1.618 ultimate bullish gartley target)
Time will tell...

RVNBTCRVNBTC
Entonnoir : W/D/H4 (swing)
Le weekly est haussier et le daily n'est plus dans sa fenêtre de tir car il est en train de compresser. Nous aurons une nouvelle fenêtre de tir sur le daily si cette future compression casse par le haut et casse également le niveau des ~985 aka le dernier sommet weekly (entouré blanc).
D'ici là j'attends que mon alarme sonne.
—————
Funnel : W/D/H4 (swing)
The weekly is in uptrend and the daily isn't safe to trade anymore as it is entering into a compression (temporarily drawn in yellow). We will have a new trading opportunity if this ongoing daily compression is breaking out by the above and also breaks the level of ~985 which is basically our last weekly top (white circle).
Since then, nothing to do except waiting for my alarm to ring.

RVN/BTC has returned to Impulse: Raven Coin back to resistanceRaven is back to the Impulse that started the pullback.
Impulse had many sellers who are probably still there.
Selling from the end of Impulse is already obvious.
Impulse = strong continuous force for a limited amount of time.
When there is a return to Impulse, it is a critical zone to watch.
Rejection from, Penetration of, or Traversal through are clues.
.
.
Ordered Chaos
every Wave is born from Impulse, like a Pebble into Water.
every Pebble bears its own Ripples, gilded of Ratio Golden.
every Ripple behaves as its forerunner, setting the Pulse.
each line Gains its Gravity.
each line Tried and Tested.
each line Poised to Reflect.
every Asset Class behaves this way.
every Time Frame displays its ripples.
every Brain Chord rings these rhythms.
He who Understands will be Humble.
He who Grasps will observe the Order.
He who Ignores will behold only Chaos.
Ordered Chaos
.
.
.
want to Learn a little More?
can you Spend a few Moments?
click the Links under Related.


$RVN Bounce but looks exhausted$RVN Bounce happened at .5 Fibonacci retracement level giving another 16% up, but looks exhausted
Volume is low
MACD bearish
RSI rising but close to overbought levels again
UCTS sell signal on the daily
I don't see an entry here for #RVN
Wait for better confirmation

RVN Head and Shoulder formationInformation obtained from Investopedia:
What Is A Head And Shoulders Pattern?
A head and shoulders pattern is a chart formation that resembles a baseline with three peaks, the outside two are close in height and the middle is highest. In technical analysis, a head and shoulders pattern describes a specific chart formation that predicts a bullish-to-bearish trend reversal. The head and shoulders pattern is believed to be one of the most reliable trend reversal patterns. It is one of several top patterns that signal, with varying degrees of accuracy, that an upward trend is nearing its end.
The head and shoulders pattern forms when a stock's price: Rises to a peak and subsequently declines back to the base of the prior up-move. Then, the price rises above the former peak to form the "nose" and then again declines back to the original base. Then finally, the stock price rises again, but to the level of the first, initial peak of the formation before declining back down to the base or neckline of chart patterns one more time.
Key Takeaways
A head and shoulders pattern is a chart formation that resembles a baseline with three peaks, the outside two are close in height and the middle is highest.
A head and shoulders pattern describes a specific chart formation that predicts a bullish-to-bearish trend reversal.
The head and shoulders pattern is believed to be one of the most reliable trend reversal patterns.
The head and shoulders chart pattern is popular and easy to spot pattern once a traders are aware of what they are watching for. The pattern appears on all times frames and can therefore be used by day and swing traders as well as investors. Entry levels, stop levels and price targets make the formation easy to implement, as the chart pattern provides important and easy-to-see levels.
Formation of the pattern:
Left shoulder: Price rise followed by a left price peak, followed by a decline.
Head: Price rise again forming a higher peak.
Right shoulder: A decline occurs once again, followed by a rise forming the right peak which is lower than the head.
What Does A Head And Shoulders Pattern Tell You?
A head and shoulders pattern is comprised of three component parts:
After long bullish trends, the price rises to a peak and subsequently declines to form a trough.
The price rises again to form a second high substantially above the initial peak and declines again.
The price rises a third time, but only to the level of the first peak, before declining once more.
The first and third peaks are shoulders, and the second peak forms the head. The line connecting the first and second troughs is called the neckline.
Head and shoulders patterns can also signal that a downward trend is about to reverse into an upward trend. In this case, the stocks price reaches three consecutive lows, separated by temporary rallies. Of these, the second trough is the lowest (the head) and the first and third are slightly shallower (the shoulders). The final rally after the third dip signals that the bearish trend has reversed and prices are likely to keep moving up.

RVNBTC Binance,Bittrex The last pullback to go downMaybe the last target for RVN Because volume is down is a good an idea to be ready to stop lost for take the profit. Good Look!!!

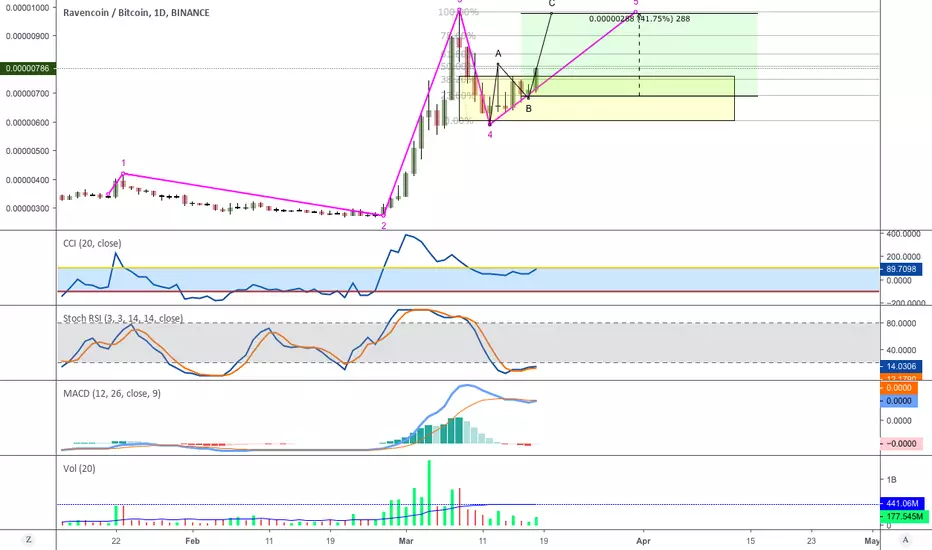
Possible targets for RVNBTC before stronger upside movementsLong waited Impulsive wave happened and correction is halfway maybe!
Targets are resulted by HS and Fibo levels!
Ravencoin (RVN/BTC) pointing to loose 50%Ravencoin went parabolic last two weeks and is now falling. Target drawn for Ravencoin (RVN/BTC) with a possible bottom at 470 sat.

SoT Chartoff - week 2 - RVNRelevant on the monthly:
- volume going up, price going up
Relevant on the weekly:
- price was moving up, but than volume died and price also coming down
- broke out of longtime downwards trendtwo weeks ago
Relevant on the daily:
- Price going down, volume going down => this move is getting exhausted, price should go back up
- distribution almost exhausted? Should wait and see how we exit the daily wedge
Relevant on the 4H
- trying to break through downwards movement, distribution ending?
- not sure what to make of the volume
Relevant on the 1H
- by looking at volume, can see downwards pricemovement is getting exhausted
- there is a trendline which still acts as resistance, broke through once but could not gain it


rvn btc looks good for a bouncegotta be careful and quick to lock in profits but on a k min chart you have 4 bottom support touches
vol holding selling has left and I think a easy scalp is coming

RVNBTC retrace UPDATE: RavenCoin at support but may hit 500 satsRVN pulling back nicely, in sync with Fibs.
Currently at a support, but looks likely to break.
Fib of wave down looks headed to 3.618 or 4.236.
575 seems likely for the ABC target.
500 should be strong support if reached.
750 will be resistance and hard to break.

Higher More HigherRVN getting adjustment after hit the ATH.
If RVN is going to make new higher, this is last chance to buy zone.
If the break down the cloud, I will cut off my RVN :P

RVNBTC retrace watch: RavenCoin pulling back finally?RVN with quite a ravenous rampage with 3 different Impulses.
"3 Drives Pattern" in play here, only measured with precision.
During retrace, "Confluence of 2" or of 3 are of utmost interest.
750 sats would be a nice place to bounce given psych value.
640 sats is bulls' Ideal defense, being the top of last Impulse.
535 sats is bulls' Last Stand, without much support below.
