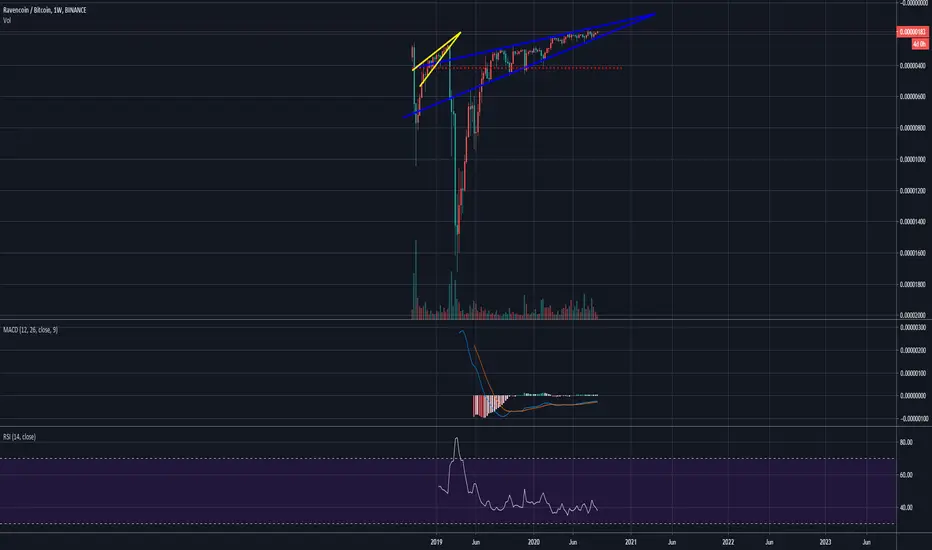
RVNBTCMy entry area.
Rvn is shitcoin as many of it, so it will never go on ATH...
But buying in this area 75-50 sats is very possible.
RVNBTC trade ideas

RVN/BTC (Strong Downtrend) 💎Technical Analysis Summary💎
BINANCE: RVNBTC
-Ravencoin is on a strong downtrend movement for the past months
-At the moment, the price has reached the 1.618 Fib reverse support
-It might be a good buy zone for long term investors
-But for traders who are just looking for a swing position
-They wait for proper confirmation or Bullish signs
A big Thanks for donating 💰 via Tradingview coins this week to billstenzel 🙏🎉
``````````````````````````````````````````````
Trading Involves High Risk ⚠️
Not Financial Advice 💸
Please Exercise Risk Management 💱
``````````````````````````````````````````````
Thank You All!🙏😊💖For Supporting My Channel 📺
Through Leaving A Thumbs Up, Comment & Follow 💬
Happy Trading!😊💕💖
``````````````````````````````````````````````

RVN looking ready to popI'm sure if you're reading this, you either hold raven, or you've been watching it's chart, wondering when this down trend is going to end. Well, it seems it's close to the end of its formation. Will it happen? The chart looks good, and if history repeats itself, it could be in for some really nice gains. It's currently oversold on the daily, and very oversold on the weekly. It's also completing a fractal of it's previous run up. This one requires patience, but I believe the reward will far outweigh the short term price action to the downside.

RVN/BTC 1D (Binance Spot) Falling wedge breakout & on support#Ravencoin has been retracing for a long time now, a move up seems to be coming!
Since it broke out already and it's on big descending channel support, that looks like a good buy zone.
Current Price= 0.00000115
Buy Entry= 0.00000116 - 0.00000110
Take Profit= 0.00000128 | 0.00000144 | 0.00000162
Stop Loss= 0.00000098
Risk/Reward= 1:1 | 1:2.07 | 1:3.27
Expected Profit= +13.27% | +27.43% | +43.36%
Possible Loss= -13.27%
Fib. Retracement= 0.236| 0.5 | 0.786
Margin Leverage= 1x | 3x | 5x
Estimated Gain-time= 2400h


Time to collect some rvn1d falling wedge inside falling parallt channel we also having 1d bullish divergence. Maybe a fakeout possible down to test parallel channel then up.
Buy zone:- 90-110
Sell:- 220+
S/L:- 82

RVNBTC: Tired of waiting. Surely anytime now?RVN falling for over a month now. Surely has to bounce?

$RVN falling wedgeI agree with some ideas published about the falling wedge, but... $rvn could easy visit the 100 satoshi region or lower before decide to start the climb.

RVN Downstream channel. U-turn zone. Past idea +20,30,50,47,30%RVN / BTC (ravecoin) Traded this coin about 9-10 months ago. When there was a breakout of the falling wedge resistance and the possibility of a trend reversal. I partially made several moves, then in the last buy, the price went against me, and I exited the market position. The previous support was broken. Since then, I have not been interested in this coin. The observation began at the end of August. This is an update to an old trading idea for this coin.
The situation is very interesting now. Local downlink. Price approached its support (lower channel border) This zone can act as a reversal zone, at least for a local trend. The potential of the channel itself is + 40%. The breakdown of the resistance of this local downtrend channel and the price fixing above the resistance can cause the main trend to reverse.
Former trading ideas of this coin:
RVN Falling Wedge. First target + 30% Figure potential + 100%
RVN. Cycle. Coin for the pumps. Global target
Result. Breakout of wedge resistance. The emergence of a trend.
+ 20% + 30% + 50% Second target taken.
RVN Symmetrical Triangle 50/50. Pivot Points. Price clamped.
+ 47% From the buy zone to the 3 target local zone.
+30%


RVN SUPER BULLİSHLittle time left for the wedge to break.
Will follow the red arrow very quickly when the break occurs.
Has 50% potential with a single candle.
I think the last bottom is seen, after that move up.
This coin is famous for its rapid rise, show yourself the time.
I bought from 166 sats, Let's go break the wedge.
Good Luck.


You wanna be buying these divergence stacks when you get themTitle, seriously, that's all I have to say,

RVN at STRONG support, good fresh setup.Hi
In pair RVN/BTC we can see that rvn is facing strong support. RSI 4H/1D very bullish.
Entry: 0.00000173-178
1. Target - 0.00000193
2. Target (Mid-Term) - 0.00000250
Enjoy guys! Hit like if you agree! :)

Look at this and ask yourself what would you do...Here's the RVN chart. Inverted. Would you ever go long on a chart pattern like this? Who in their right mind would go long on a chart pattern like this? This looks absolutely horrific. Now let's remember, this chart is inverted. So if you saw this on something like say, BTC, you would probably start screaming, OH NO IT'S GOING TO 0! hahaha... ah yes, patience is key here. This chart pattern is too good to pass up. Buy the dip. Ride the moves out. Wait for the breakout.
The range is getting tighter and tighter, it's only a matter of time before this gets the reversal that it's hinting at. 100% move minimum upon breakout. Market makers don't care for fundamentals. Don't look for a 'reason', the chart is the reason. If this doesn't ever reverse to all time highs, I will say that I would be extremely shocked.
Oh yeah, and don't forget the tight range on the RSI which is slowly making higher lows, and the slim slim histogram of the MACD indicating small insignificant movements in price.
Ravencoin finally taking off !! Do expect a surprise !!Short heads up at 226 satoshi !
I was waiting for weeks ...
Now this coin is finally moving...
DO EXPECT A SURPRISE !!
Not financial advice ... but that is what my guts are telling me !!!

Remember The FlightRemember to always, always place your stop loss at the appropriate levels immediately after you have put in your long/short position so as not to get stopped out at your trades.
>>>>> Always be prepared for either scenario of upwards movement, downwards movement, or sometimes even sideways movement (consolidation phase & sometimes even extended consolidation phases). <<<<<
Constructive and positive comments are welcome.
Consider leaving a like after viewing my post, and click on Follow to receive my latest and updated posts

Potential for developing an inverse h&sHere we can see hidden bullish divergence on the macd, macd histogram, and RSI. If the right shoulder forms completely and the price action breaks above the descending resistance of the larger wedge formation, we could see the price hit around 250 sats prior to pushing any higher. Targets for any mid term trades are still much greater than 255 sats however, especially considering the momentum that could ensue from the wedge breaking out.

Just about 67% in to the wedge formationIt is often observed that the most strong breakouts occur between 60-70% of the length of the formation. This can be quickly observed as well in the previous descending wedge that broke out in 2019.
We are currently about 67% of the way into the wedge that I have drawn here.
Take note also, that there are also hidden bullish divergences occuring on the weekly chart (not drawn in this analysis, but look for them).
A minimum target from the current price is around a 100% move to a historic level of confluence represented by the dotted red line. If the descending wedge has a vigorous break to the upside, we could also have confirmation of a fractal pattern which would indicate that the coin's value in BTC should also surpass it's previous ATH, presenting a 9x gain potential at minimum from the current price.
Remember, a project doesn't necessarily have to be good or bad for it to make large returns on investment.
