$RWA is ready for a massive 50% pump.About RWA:- Allo is building the world’s first exchange for tokenised stocks with 24/7 trading, low fees and instant settlement to democratize investing. Built on blockchain technology, Allo has tokenised $2.2B in RWAs, staked $50M in BTC, and launched a $100M lending facility.
The fundamentals loo
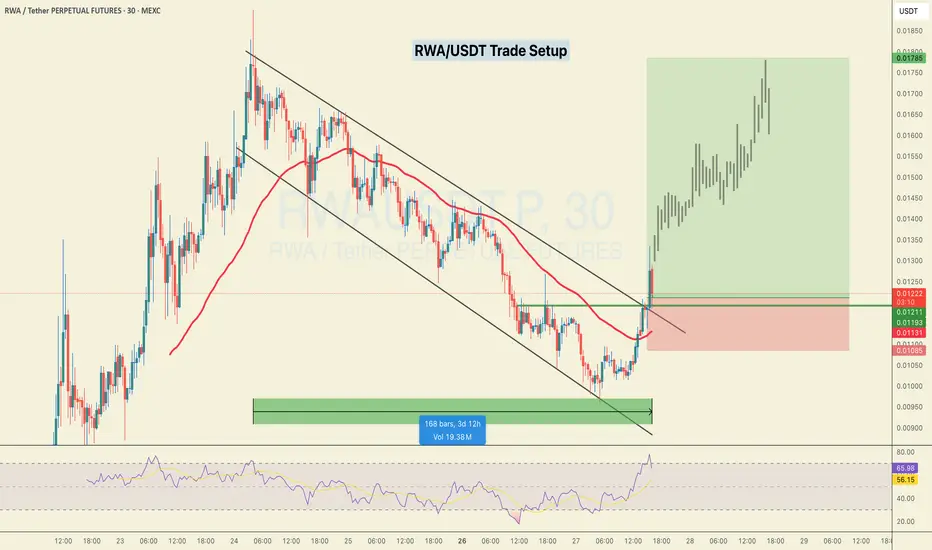
$RWA Breakout Alert – Trend Reversal in Play?LSE:RWA just broke out of a falling channel with strong volume — signaling a potential trend reversal.
It’s now retesting the breakout zone near the 0.382–0.5 Fib level, which could act as a support area before the next leg up.
If this reclaim holds, upside targets extend toward $0.017+—a 40%+ mo

$RWA Breakout Setup LSE:RWA just broke out of the channel with strong momentum.
- Entry: NYSE:CMP
- Target: $0.01454 – $0.01900
- SL: $0.01064
DYRO, NFA

RWA: $0.016 | from the Packager of BnB & PancakeswapUniswap took the defi space into another level which led to the birth of sushi 1inch and later comes PANCAKESWAP perfecting democratizing how a freshman neophyt gets into defi decental space
Valued at $6bn
--
BnB a platform dominating the global scene in ONBOARDING every joe in the world in gettin

$RWA Volume Decline Signals Bearish ContinuationAnalysis: LSE:RWA ’s price at $0.01 is accompanied by declining trading volume, indicating fading bullish momentum. The Parabolic SAR is above the price, signaling a downtrend. A break below $0.0095 could push prices to $0.007. Short with a stop above $0.0103 for a high-probability trade.
Indicator

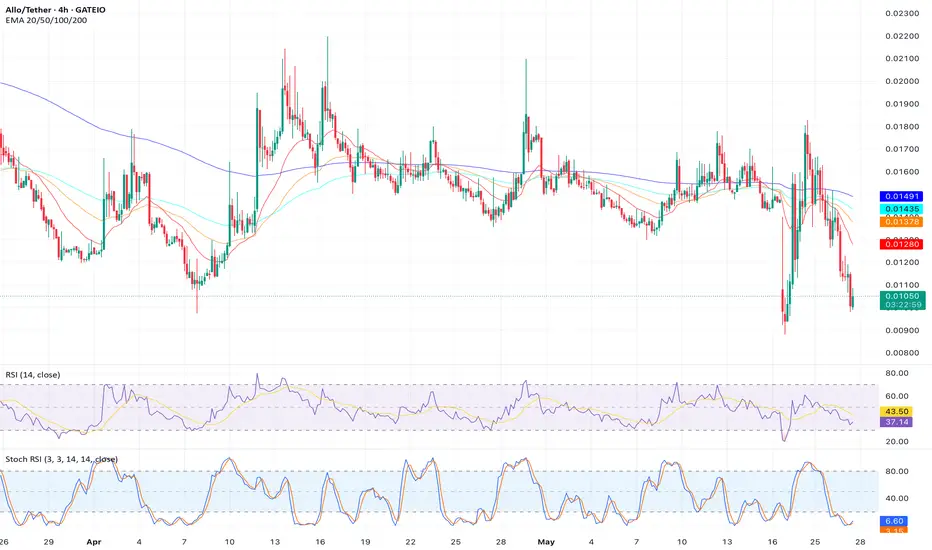
$RWA Bearish Divergence Warns of PullbackAnalysis: LSE:RWA ’s recent rally to $0.01 shows a bearish divergence on the RSI, with lower highs despite price stability. The stochastic oscillator is in the overbought zone, suggesting exhaustion. Expect a drop to $0.0088 if $0.01 fails. Short with a stop above $0.011.
Indicators: RSI, Stochasti

$RWA Downtrend Confirmed Below $0.01Analysis: LSE:RWA has broken below the $0.01 support, confirming a bearish trend on the daily chart. The 20-day EMA ($0.0105) is acting as resistance, and the RSI at 35 shows no signs of reversal. Short with a target of $0.0078 and a stop above $0.0105.
Indicators: 20-day EMA, RSI
Timeframe: Daily

$RWA Head-and-Shoulders Pattern Signals DeclineAnalysis: A head-and-shoulders pattern is forming on LSE:RWA ’s 4-hour chart, with the neckline at $0.0098. The price is testing $0.01, but weak volume and a bearish MACD crossover suggest a breakdown. Short below $0.0098, targeting $0.0075, with a stop above $0.0105.
Indicators: MACD, Volume, Head

$RWA Testing Critical $0.01 Support, Downside LikelyAnalysis: LSE:RWA is hovering at $0.01, but the Bollinger Bands are tightening, signaling potential volatility. The price is below the middle band ($0.0103), and the ADX at 30 indicates a strengthening downtrend. A break below $0.0095 could target $0.007. Short with a stop above $0.0105.
Indicator
$RWA Overbought RSI Signals CorrectionAnalysis: Despite LSE:RWA ’s recent spike to $0.01, the RSI at 80 indicates overbought conditions on the 1-hour chart. A death cross on the 50/200 EMA is forming, suggesting a pullback. Short at $0.01 with a target of $0.0085 and a stop above $0.0105. Watch for declining volume to confirm the rever

See all ideas