SAGAUSDT Breaks Free After Long Consolidation.Big Moves Ahead?SAGAUSDT Breaks Free After Long Consolidation.Big Moves Ahead?
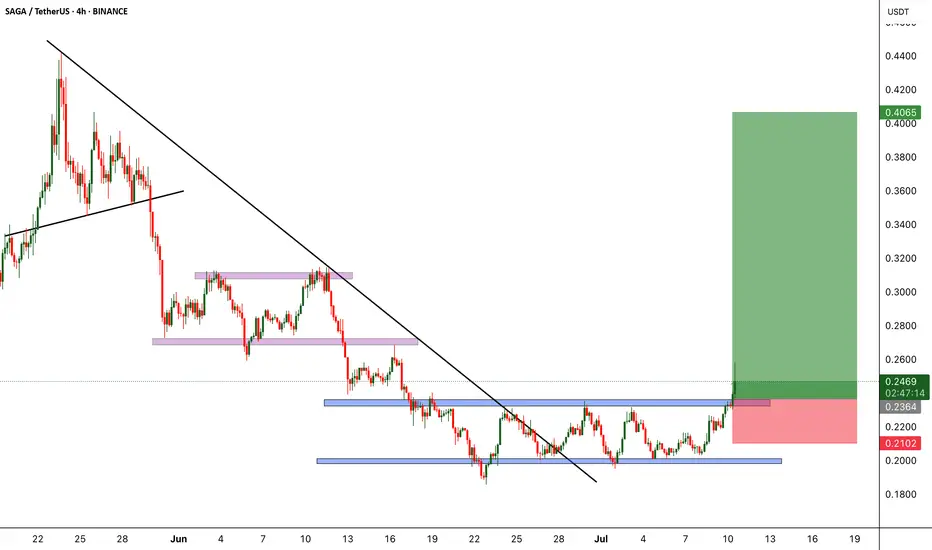
BINANCE:SAGAUSDT was consolidating within a tight range for quite some time, forming a classic accumulation box. Today, it finally broke out of that zone with strong momentum, signaling the potential start of a bullish move. This brea
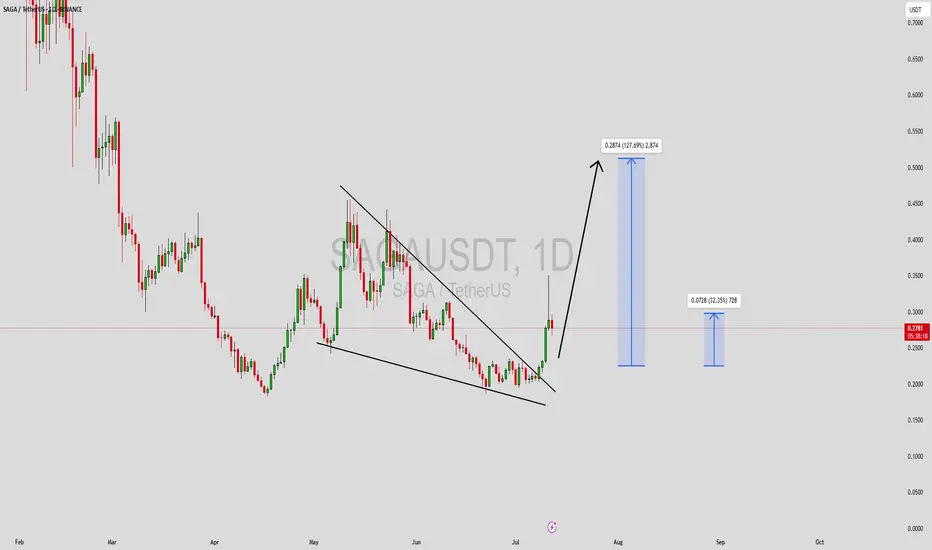
SAGAUSDT Forming Falling WedgeSAGAUSDT is showing promising signs of a trend reversal as it completes a falling wedge pattern, which is a widely respected bullish continuation signal in crypto trading. This chart structure suggests that the recent downtrend could be coming to an end, with the price poised for a strong upward bre
SAGA (can pump like ALT did?)SAGA and similar cycle-growth coins (not necessarily same sector or area)
More from a perspective from a similar chart pattern and also similar listing date/period
For more details please give a comment
we have many bullish indicators as well > KDJ
Also look at
AEVO XAI and so on. DYM MANTA ACE AI

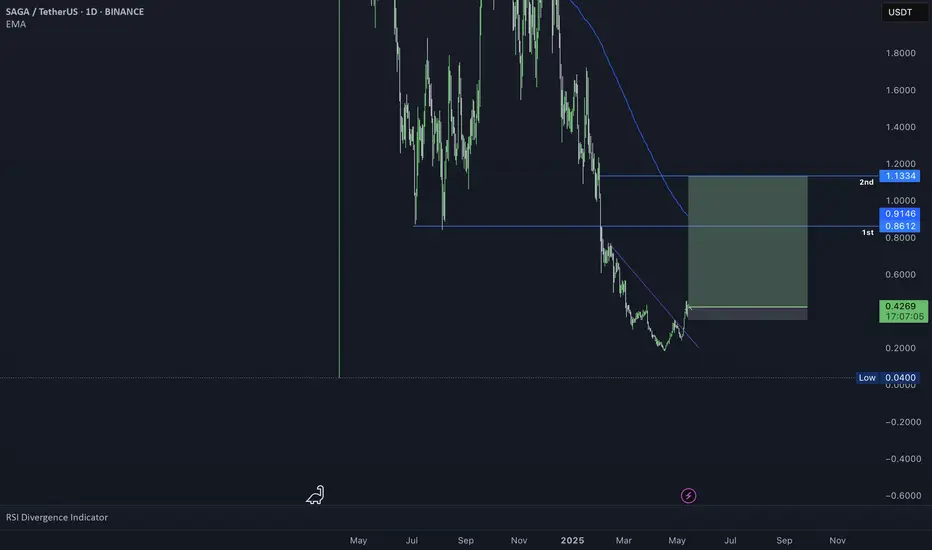
SAGA | Inverse Head & ShoulderOn the daily timeframe, SAGA/USDT is presenting a bullish reversal pattern in the form of an Inverse Head and Shoulders, further validating the its high green volumes. This is a classic technical signal that often precedes a significant trend reversal, especially after a prolonged downtrend like the

SAGA SHORT RESULT SAGA price rejected from minor Support level due to Pump in BTC and Altcoins Generally.
Took a little hit on this one, wasn't paying attention to it actually, would've closed at the break out of the first resistance Trendline.
But it's part of trading. Better Setup and profits coming soon.
_THE_KLA

SAGA SHORT SETUPSAGA Price is consolidating within the range of a Falling Expanding Wedge Pattern, after the major dump ,So I decided to open the Short within the resistance and support ranges of the pattern.
It's still running, so we'll see how it goes.😉

SAGA SHORT RESULTSAGA price was still in a Bullish trend when I opened this short position, because it already started showing minor signs of weakness and that's why I decided to short anticipating the The Breakdown of the Ascending Trendline Support.

SAGAUSDT 1D#SAGA has broken out above the broadening wedge pattern on the daily chart with strong volume. Currently, it is retesting the pattern. In case of a successful bounce, the targets are:
🎯 $0.5651
🎯 $0.8232
🎯 $1.2156
🎯 $1.5327
🎯 $1.8498
⚠️ Use a tight stop-loss.

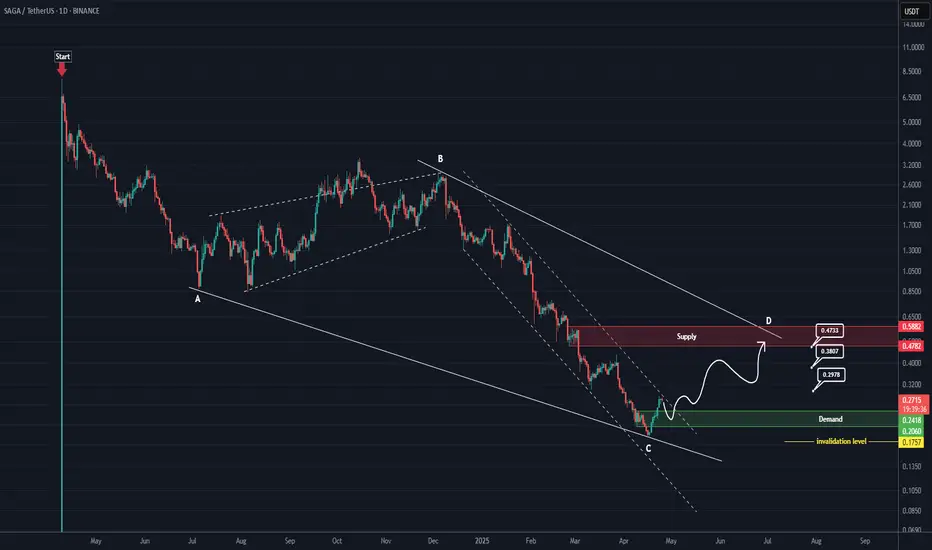
SAGA RoadMap (1D)From the point where we placed the red arrow on the chart, it appears that SAGA's correction has begun.
This correction seems to be either a diametric or a symmetrical pattern. Now, considering the extended duration of wave C, its relative comparison with the other waves, the heavy drop, and the fo
See all ideas
Summarizing what the indicators are suggesting.
Oscillators
Neutral
SellBuy
Strong sellStrong buy
Strong sellSellNeutralBuyStrong buy
Oscillators
Neutral
SellBuy
Strong sellStrong buy
Strong sellSellNeutralBuyStrong buy
Summary
Neutral
SellBuy
Strong sellStrong buy
Strong sellSellNeutralBuyStrong buy
Summary
Neutral
SellBuy
Strong sellStrong buy
Strong sellSellNeutralBuyStrong buy
Summary
Neutral
SellBuy
Strong sellStrong buy
Strong sellSellNeutralBuyStrong buy
Moving Averages
Neutral
SellBuy
Strong sellStrong buy
Strong sellSellNeutralBuyStrong buy
Moving Averages
Neutral
SellBuy
Strong sellStrong buy
Strong sellSellNeutralBuyStrong buy
Displays a symbol's price movements over previous years to identify recurring trends.