SAGAUSDT Breaks Free After Long Consolidation.Big Moves Ahead?SAGAUSDT Breaks Free After Long Consolidation.Big Moves Ahead?
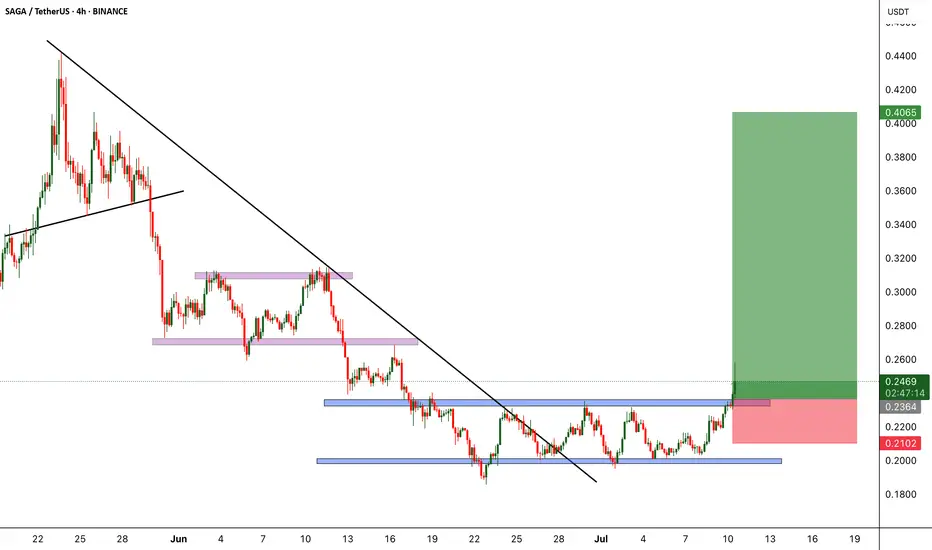
BINANCE:SAGAUSDT was consolidating within a tight range for quite some time, forming a classic accumulation box. Today, it finally broke out of that zone with strong momentum, signaling the potential start of a bullish move. This breakout could be the beginning of a bigger trend, and we’re eyeing further upside in the coming sessions.
As always, risk management is key, make sure to place your stop loss wisely and protect your capital.
#SAGAUSDT Currently trading at 0.245
Buy level : Above $0.235
Stop loss : Below $0.21
Target : $0.4
Max leverage 5x
Always keep stop loss
Follow Our Tradingview Account for More Technical Analysis Updates, | Like, Share and Comment Your thoughts
SAGAUSDT.P trade ideas
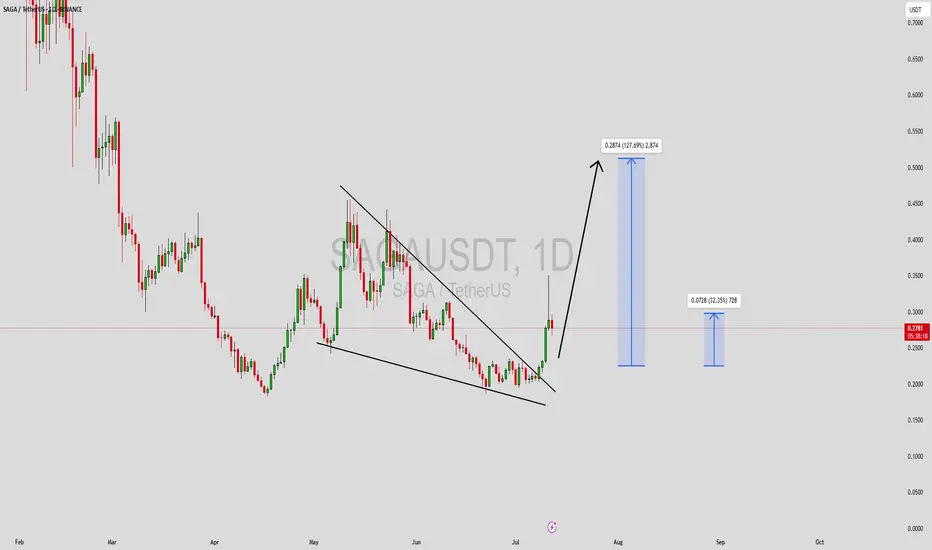
SAGAUSDT Forming Falling WedgeSAGAUSDT is showing promising signs of a trend reversal as it completes a falling wedge pattern, which is a widely respected bullish continuation signal in crypto trading. This chart structure suggests that the recent downtrend could be coming to an end, with the price poised for a strong upward breakout. The current market volume looks healthy, adding weight to the possibility of this setup playing out successfully. With an expected gain of 90% to 100%+, this pair could attract significant attention from swing traders and position traders looking to capitalize on the next big move.
This crypto pair has been drawing increasing interest from investors due to the innovative vision behind the Saga ecosystem and its growing presence in the decentralized applications space. Community sentiment has turned optimistic as fresh liquidity appears to be entering the market, a critical factor for sustainable bullish momentum. As more buyers step in to accumulate around the wedge support, the likelihood of a confirmed breakout strengthens.
Traders should keep a close watch on key breakout levels and look for strong bullish candles closing above the wedge resistance line. An ideal scenario would include a volume spike accompanying the breakout, as this often validates the breakout strength and confirms that new buyers are stepping in aggressively. Proper risk management remains crucial—placing stop-losses below recent swing lows can protect capital while riding this high-probability setup.
✅ Show your support by hitting the like button and
✅ Leaving a comment below! (What is You opinion about this Coin)
Your feedback and engagement keep me inspired to share more insightful market analysis with you!
SAGA (can pump like ALT did?)SAGA and similar cycle-growth coins (not necessarily same sector or area)
More from a perspective from a similar chart pattern and also similar listing date/period
For more details please give a comment
we have many bullish indicators as well > KDJ
Also look at
AEVO XAI and so on. DYM MANTA ACE AI CYBER OMNI and so on

SAGA | Inverse Head & ShoulderOn the daily timeframe, SAGA/USDT is presenting a bullish reversal pattern in the form of an Inverse Head and Shoulders, further validating the its high green volumes. This is a classic technical signal that often precedes a significant trend reversal, especially after a prolonged downtrend like the one SAGA has experienced.
What makes this setup compelling is that the neckline—around the $0.43–$0.45 region—is being tested. A successful breakout above this resistance would confirm the pattern and potentially trigger a strong bullish move. The height of the pattern projects a measured move toward the $0.80–$0.83 range.

SAGA SHORT RESULT SAGA price rejected from minor Support level due to Pump in BTC and Altcoins Generally.
Took a little hit on this one, wasn't paying attention to it actually, would've closed at the break out of the first resistance Trendline.
But it's part of trading. Better Setup and profits coming soon.
_THE_KLASSIC_TRADER_.

SAGA SHORT SETUPSAGA Price is consolidating within the range of a Falling Expanding Wedge Pattern, after the major dump ,So I decided to open the Short within the resistance and support ranges of the pattern.
It's still running, so we'll see how it goes.😉

SAGA SHORT RESULTSAGA price was still in a Bullish trend when I opened this short position, because it already started showing minor signs of weakness and that's why I decided to short anticipating the The Breakdown of the Ascending Trendline Support.

SAGAUSDT 1D#SAGA has broken out above the broadening wedge pattern on the daily chart with strong volume. Currently, it is retesting the pattern. In case of a successful bounce, the targets are:
🎯 $0.5651
🎯 $0.8232
🎯 $1.2156
🎯 $1.5327
🎯 $1.8498
⚠️ Use a tight stop-loss.

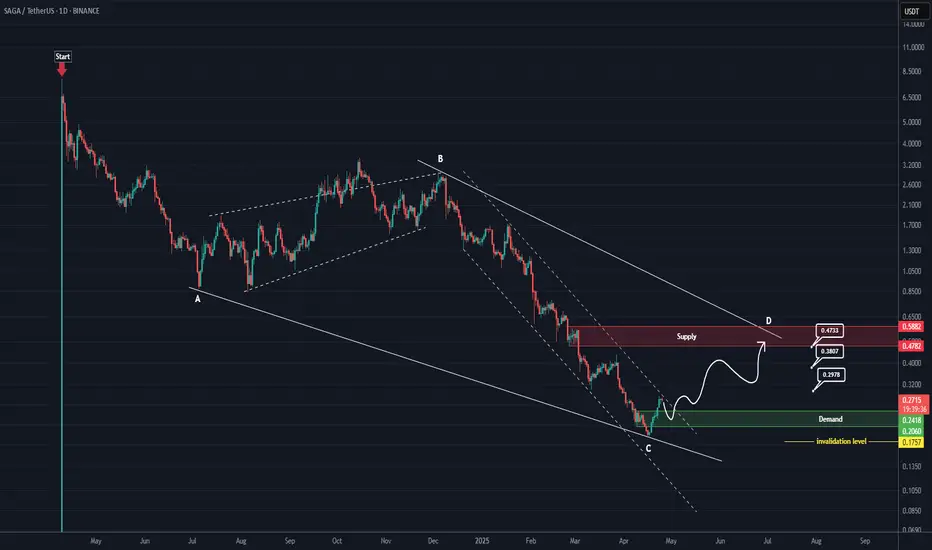
SAGA RoadMap (1D)From the point where we placed the red arrow on the chart, it appears that SAGA's correction has begun.
This correction seems to be either a diametric or a symmetrical pattern. Now, considering the extended duration of wave C, its relative comparison with the other waves, the heavy drop, and the formation of a demand zone at the bottom, wave C seems to have ended.
A rebuy can be considered on the pullback to the green zone.
The targets are marked on the chart.
A daily candle closing below the invalidation level will invalidate this analysis.
For risk management, please don't forget stop loss and capital management
Comment if you have any questions
Thank You
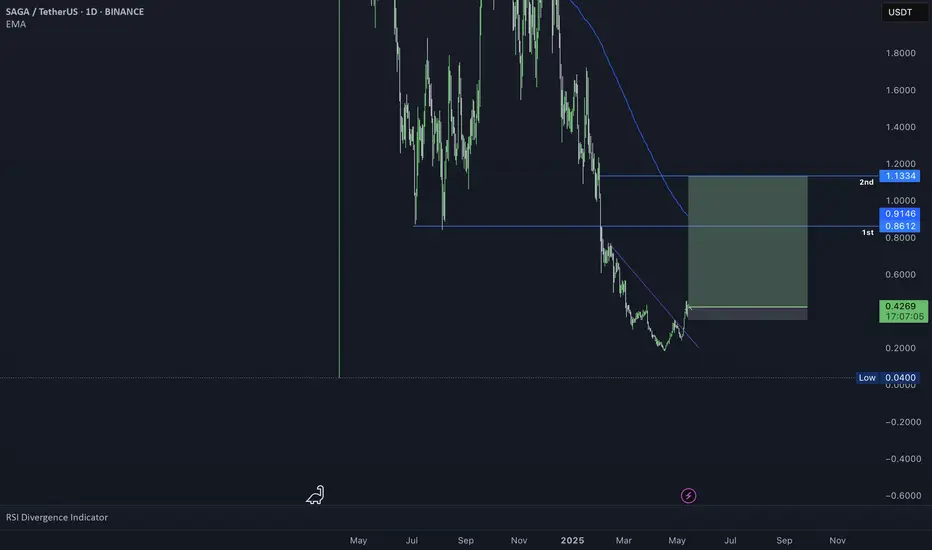
SAGAUSDTNow is the time to buy and hold with low risk.
Target: 0.70
Stop-loss: Weekly candle close below 0.17
I'm just sharing my personal opinion to help us all better understand the market’s potential.
Always do your own research before investing — don’t rely solely on my view as a beginner, or anyone else's, even top analysts.
No one can predict the future with certainty.
Wishing peace and clarity to everyone.

SAGA Rebuy Setup (8H)A strong move has formed, and we have a bullish CH (Change of Character) on the chart.
We can look for buy/long positions around key zones, as buyers are present in these areas.
We are focusing on buy/long positions at the entry points.
Targets are marked on the chart.
A daily candle close below the invalidation level will invalidate this analysis.
For risk management, please don't forget stop loss and capital management
Comment if you have any questions
Thank You

SAGAUSDT 2D AnalysisSAGA ~ 2D Analysis
#SAGA Buy after successfully penetrating this resistant line with a short -term target of at least 15%+ from here.

$SAGA Long Trade #freesignal
LSE:SAGA Long
Leverage : 3-5x
Entry 1 : 1.415
Entry 2 : 1.32
TP: 1.6177
SL : 1.2288
I want you to use SL and do proper risk management thanks.
like and share with love

SAGAUSDTmy entry on this trade idea is taken from a point of interest above an inducement (X).. I extended my stoploss area to cover for the whole swing as price can target the liquidity there before going as I anticipate.. just a trade idea, not financial advise
Entry; $0.2819
Take Profit; $0.2612
Stop Loss; $0.2949

SAGA buy/long setup (4H)The SAGA symbol has made significant breakouts and formed a support zone. Additionally, there is a bullish iCH on the chart.
We can look for buy/long opportunities on this symbol.
Targets are marked on the chart.
A daily candle closing below the invalidation level will invalidate this analysis.
For risk management, please don't forget stop loss and capital management
When we reach the first target, save some profit and then change the stop to entry
Comment if you have any questions
Thank You

SAGAUSDTmy entry on this trade idea is taken from a point of interest below an inducement (X).. I extended my stoploss area to cover for the whole swing as price can target the liquidity there before going as I anticipate.. just a trade idea, not financial advise
Entry; $1.0158
Take Profit; $1.1015
Stop Loss; $0.9886

SAGA Long OpportunityThis is the type of trade which I take without thinking twice.
Bottom with bullish RSI divergence
Higher high without divergence
Impulsive pattern to the upside, corrective pattern to the downside
Low risk, high reward
You can enter half or 1/3 position here and wait and see, if the SL is hit, makes little impact.


3.45 RRSaga held Polarity, and is laddering long-term. The recent higher high suggests once a local bottom is found--coupled with the lack of strong resistance on the top--a new local high can be achieved. Target 1 should be a fairly safe exit in light of this possibility.

SAGAUSDT 2DSAGA ~ 2D
#SAGA If you still have Conviction on the coin,. This support block would be a very good buying place for now,. with a minimum target of 20%+

$SAGA / UsdT PredictionHello traders,
The chart resembles the pattern of an inverse head and shoulders. This formation is significant because it illustrates the shifting dynamics in the market, allowing us to anticipate the next trending phase. The critical levels to watch are $1.74, $2.05, $2.83, and $3.42. If these levels are surpassed, the price could move to the next level. Otherwise, we may need to retest the previous critical level to find support.
If everything goes well, the sky is blue and the grass is green, then we can reach our final destination! I will keep you updated on this chart as we progress.

SAGA/USDT AnalysisThe price is testing the red resistance zone.
🎯 Target if breakout occurs: Green level
