saga long now ALL trading ideas have entry point + stop loss + take profit + Risk level.
hello Traders, here is the full analysis for this pair, let me know in the comment section below if you have any questions, the entry will be taken only if all rules of the strategies will be satisfied. I suggest you keep this pair on your watchlist and see if the rules of your strategy are satisfied. Please also refer to the Important Risk Notice linked below.
Disclaimer
SAGAUSDT trade ideas


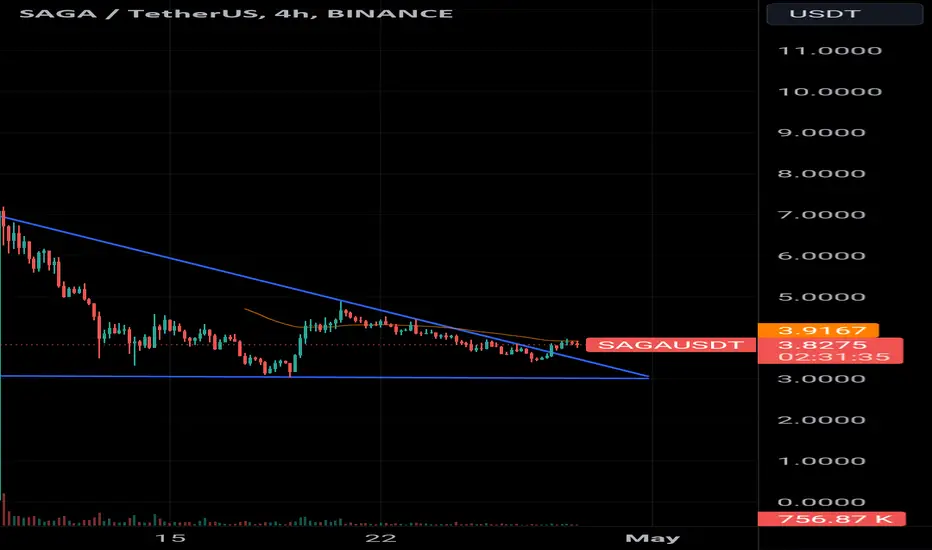
SAGA ANALYSIS🚀#SAGA Analysis : Breakout and Retest
🔮As we can see in the chart of #SAGA that there is a formation symmetrical triangle pattern. Also there is a perfect breakout. This indicates a potential bullish move.📈📈
🔰Current Price: $3.8850
🎯 Target Price: $6.6091
⚡️What to do ?
👀Keep an eye on #SAGA price action. We can trade according to the chart and make some profits⚡️⚡️
#SAGA #Cryptocurrency #TechnicalAnalysis #DYOR

#SAGA/USDT has broken out of a triangle pattern on the 4-hour ti#SAGA/USDT has broken out of a triangle pattern on the 4-hour timeframe🧐
The breakout from the triangle pattern could trigger a bullish move📈
Confirmation of a sustained breakout is necessary for the projected 60-70% bullish move to materialize☝️
SAGAUSDT LongVery close to the order block area, the price may interact with it to rise, and there is a bullet box at the top, which is a logic that is not a price equilibrium.

SAGAUSDT: Potential Reversal, Setting Buy Stop at 4.65SAGAUSDT appears to be on the brink of a turnaround, with selling pressure diminishing. A buy stop is placed at 4.65, anticipating a surge if the reversal gains traction. The planned risk/reward ratio of 1:2 suggests a conservative yet optimistic outlook on the potential for buyers to take control. Watch for a breakout above the buy stop level as an indicator of buyer momentum overpowering the sellers, signaling the start of a new uptrend.

SAGA - high risk scalpI am very curious about this one...
SAGA doesn't look good compared to others and has shown a lot of bearish market structure to the downside, with losing the monday low and the low volume node zone below it is appears as if SAGA wants to come down to the levels of the surge last week. Would be a high RR setup but a very risky on.
BTC could give the momentum in both sides but primarily I am expecting a slight move down for BTC before continuing this bullish pattern, maybe this could give SAGA a little shakeout here. If you take it please manage your risk accordingly and do it on your own research 🤝

SAGA long setup ALL trading ideas have entry point + stop loss + take profit + Risk level.
hello Traders, here is the full analysis for this pair, let me know in the comment section below if you have any questions, the entry will be taken only if all rules of the strategies will be satisfied. I suggest you keep this pair on your watchlist and see if the rules of your strategy are satisfied. Please also refer to the Important Risk Notice linked below.
Disclaimer

$SAGA Possible DeviationPrice tagged and got rejected at .618 Fibonacci level
Acceptance below 4.50 and back inside the range then we'll consider it as DEVIATION
If you'd wish to position yourself, wait for the price to retest the demand zone around 3.60 to 3.50 area

Beware, SAGA is near a resistance rangeAfter a good climb, it has reached a resistance FL range.
Even if SAGA wants to break out of this area, it must have a correction ahead. Note that this correction may not be deep, so when we reach the first target, save some profit and then place a stop on the entry.
This area can contain many sell orders.
It has also swept up a large liquidity pool.
Closing a daily candle above the invalidation level will violate the analysis.
For risk management, please don't forget stop loss and capital management
When we reach the first target, save some profit and then change the stop to entry
Comment if you have any questions
Thank You

SAGAUSDT Long IdeaI think Saga is going to touch the 1 day FVG before pushing down, you can enter at retest or you can enter now and do DCA at entry. Happy Trading guys

SAGA - altcoin ltf setupI am going to bid SAGA on the retest of the FVG top at $3.415
Eyeing $3.94 to $4.44 here. Should get some more momentum after the pullback ✅

SAGAUSDT.4HFor this SAGA/USDT 4-hour chart, the outlook is quite bearish. The asset is currently trading just above the support level (S1) at $3.3039. If this level does not hold, it could indicate a further drop in price.
The resistance level (R1) is situated at $4.3655. For a change in the current bearish trend, the price would need to break above this resistance level with significant volume to confirm a potential trend reversal.
The RSI is in the oversold territory at 32.87, suggesting that the asset might be undervalued at this point. This could potentially lead to a bounce back if buyers step in, looking for a bargain. However, the RSI being oversold can also persist during strong downtrends.
The MACD is below the baseline and the signal line, reinforcing the bearish sentiment. Yet, traders should remain vigilant for any bullish crossover in the MACD as it may indicate a shift in momentum.
Overall, this chart suggests that caution is warranted. A break below S1 could lead to a further decline, while any bullish signals, such as a rising RSI or MACD crossover, should be closely monitored for signs of a potential reversal. As always, it’s crucial to consider a range of indicators and market news when making trading decisions.

SAGAUSDT.PHello Trader BINANCE:SAGAUSDT.P
The valid falling wedge area is now in the retest area position, market price or buy order limit area 4.0972
take profit 30%
stop loss 5%
Please add a comment and Positive feedback and constructive criticism are important to authors and the community.
Disclamer: Not Financial Advice

Monitor breakout to 7 and support at 4#binance #Launchpool projects used to get dumped hours after the rewards are made available/ coin is listed. But the latest project show a more stable trend. With strong fundamentals, LSE:SAGA has potential to retest the inception #ATH
