SANDBTC trade ideas


SAND BTC Fib Ext & Rising ChannelRepetition of the previous pattern to the upside in the channel.
Bullish hammer on the daily, giving indication of a move to the upside.
Can we get a fib level of 1.618 to the upside before a pull back?
Thinking about going long once breaking above the 1227 line.
See it through to 2049 or wait for it to touch the channel?
Either way, with a solid bounce off the lower trend line good % for TP on the way up.


SAND/BTC
SAND/BTC
(SAND 4hr chart) Currently in a healthy retracement bouncing up and down of this downward trend line waiting for it to hit my buy zone and show wick rejections or
show strong signs of it holding Support. Sands been performing very well over the last month still very bullish on it. Need bitcoin to behave it self otherwise we all know what happens to alts once bitcoin starts moving
Waiting on bullish divergence on the RSI
Entering on double bottom patterns in my buy zone
Entering if it breaks the downward trend line and retest

$sand is bullishWelcome everyone to my trading idea.
Feedback is always welcome. Please leave a comment!
Disclaimer:
It's my personal vision. This idea does not provide the financial advice.

SANDBTCNot sure what to make of this until we find support. Will look for an entry upon consolidation / retest

Newest thoughts on SANDSuper heavy rejection at 1069. Now would be a good time to re-open staggered long entries as this Head-and-Shoulders pattern forms.
Obviously, a rejection as we enter the right shoulder would lead to a test of the .50 Fib but this coin has shown legs over the past few days.

I was wrong about retestLooks like pennant popped earlier than I had thought it would. Nice little cup-&-handle forming as well.
Will be staying long on this.

Views on pending patternsLooks like there's some heavy buying as well as selling pressure around 725-760 sats. The .786 might hold but I see a retest at 600 as more likely unless the bull pennant that is taking shape comes to fruition; even then though, to reach beyond 900 with no retests would leave us with a very tired looking chart. Overall, I see plenty of growth here but the profit margins on eager longs might be left without much padding. Time your positions, set your stops, ????, profit.
I've charted 3 possible paths SAND might take along these micro-view patterns; more heavy emphasis was placed on maintaining continuity with more well-established trend lines.

SAND entries incomingSAND, among other NFTs are booming and the slowdown isn't anywhere in sight. Mainstream money is flowing to these coins so downside isn't uber-risky IMO.

The Sandbox (SAND) Grows 355% In 7 Days, Over 222% in 24 Hours Finally, we have The Sandbox (SANDBTC)...
This type of growth is what I see coming for many of the altcoin charts that I read before.
Here we have over 355% growth in the past 7 days and ever 222% in just under 24 hours... This is massive.
I see many pairs with charts that are pointing to similar bullish action.
Remember, you shouldn't trade these charts... It is better to step back and have a plan in place before trading.
After the action already starts, the risk is higher and the complexity of trading increases...
But, if you buy low and near support, the rest is just waiting and the risk is minimal compared to when we already have massive growth.
Namaste.

SAND/BTC Short term analysisNFT is the next hype and Sand will blow everything soon in the short term.

#SANDBTC #DAILYHi guys..its the latest analyze chart of #SANDBTC in Daily time frame (folowers Requested analysis) .if you are interested any crypto that you want analyze with me and any questions please do not hesitate and comment below the chart!
if u like it press like-comment and folow us.thx

SAND looking good hereThis is not a financial advice. Always do your own research and always put stoploss in your trade (SL) :) If you want more detailed info how to study and read charts or just need help with some coin, just write to me here personal message, i will try to answer to everybody... i can help you :) all for free, don't worry, BE HAPPY!
If u like the analysis, please feel free to ask any question about this TA or crypto or any coin and also leave a comment or like or share the idea, i really appreciate it because then my work makes sense :) thanks!

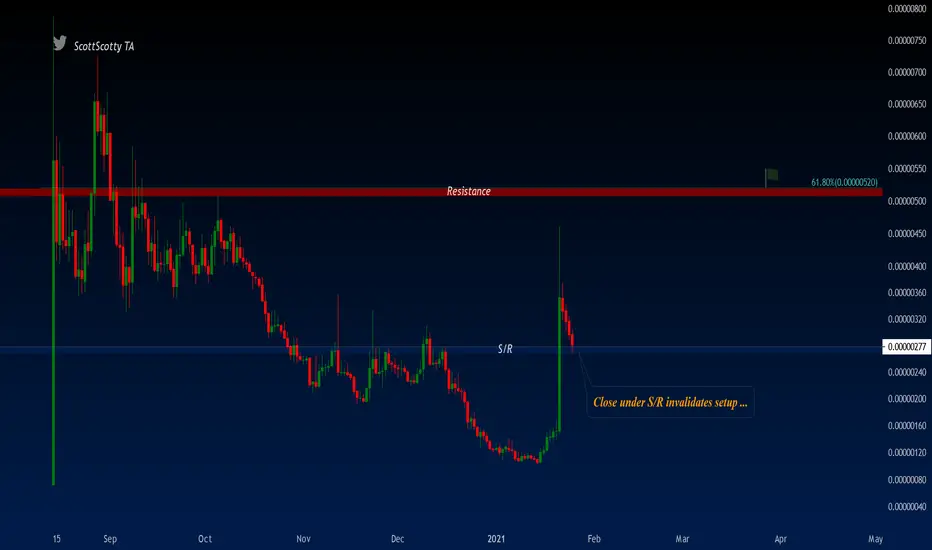
SAND-BTCSand has 2 strong resistances in front of it, if it closes on top of the first one, I believe it will pursue for the second one. There is also a strong shoulder-head-shoulder formation before it. It could be a great opportunity for a long if it drops on the weekend after closing on top of the first resistance. Drawing is a bit off in terms of time


SAND: good short opprtunitySAND just bounced. It's a good opoprtunity to short as the altcoin markets should dump relative to BTC.

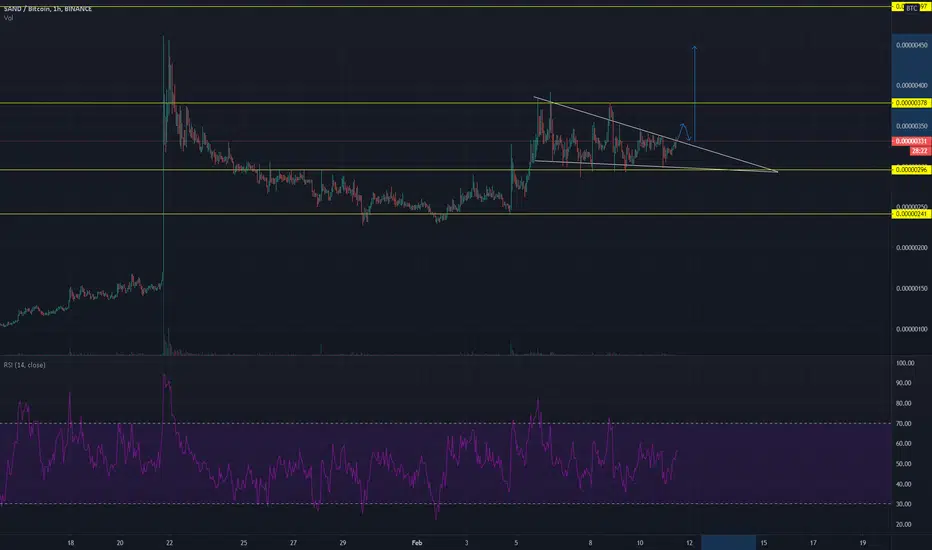
SAND/BTC descending triangle SAND/BTC on the 1hr chart is currently in a descending triangle and is holding strong at the 300 support level.
Waiting on the break of the triangle to retest and could be looking a some pretty good gains

BINANCE: SAND/BTC🛒 Pair: SAND/BTC 🛒
== SPOT==
⏰ 1399/10/26 ⏰
🕰 15/01/2021 🕰
#22
Duration:
📈 SHORT - MID📈
Ex: Binance
🛒 Buy1 : 140 🛒
🛒 Buy2 : hidden🛒 DCA
👉Sell Targets👈
🎯TP1: 149 🥉
🎯TP2: hidden🥈
🎯TP3: hidden🥇
🎯TP4: hidden🏆
🎯TP5: hidden🚁
🎯TP6: hidden✈️
🎯TP7: hidden🚀
🎯TP8: hidden🛰
🎯TP9: hidden🛸
🎯TP10: hidden✨
🟥SL: 114

