SANDUSDT Breaks Major Downtrend – Golden Pocket Retest!
Technical Analysis:
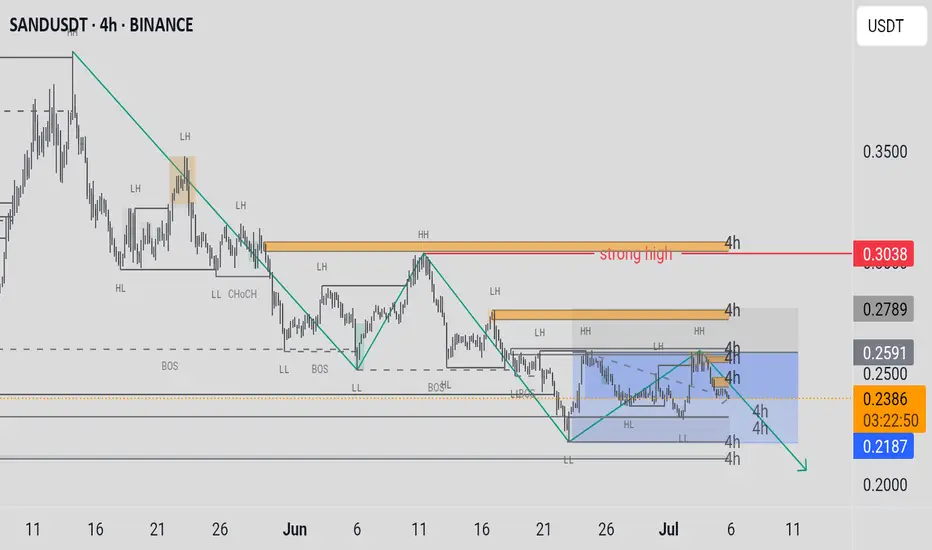
SAND/USDT has successfully broken out of a descending trendline that had been capping the price since late 2024. The breakout occurred with increased volume, signaling strong buyer interest.
Following the breakout, price rallied and is now retesting a key support zone, which i
Related pairs

SANDUSDTSAND/USDT (The Sandbox):
○ Trend: Strong uptrend.
○ Current Condition: Price is consolidating around $0.32-$0.33, after reaching a high of around $0.34-$0.35, and is below significant resistance at $0.39-$0.40. Volume is decreasing during the consolidation phase.
○ Entry Recommendation: Not optimal

Sandbox (SAND): Really Good Buying OpportunitySAND is at a golden spot for potential good upward movement to happen once we see a proper breakout from that 200 EMA line.
We are seeing a great R:R trading setup here so might as well try it out, but wait for a proper break from that EMA.
Swallow Academy

SANDUSDT – Long-term Spot Buy RecommendationSANDUSDT – Long-term Spot Buy Recommendation
Context: Many in the community have suffered from buying SAND at much higher levels, leading to heavily divided portfolios due to continuous DCA during the bottoming phase.
Now, our bottom detection system has been triggered—it's time to accumulate.

SAND – Rotation in PlaySAND is showing early signs of strength off the long-term demand zone near $0.23–0.24, where it's been accumulating for several months. Price just printed a strong weekly bounce, up +16%, reclaiming the bottom of the range.
This area has acted as a key base since mid-2023 — with each touch producin

Sandbox (SAND): Looking For Break of 200EMASandbox has been in a downtrend for quite some time, and currently we are looking for proper upward movement, which could give us a decent switch in trend and an opportunity for long positions.
So as of now we have to wait and once we get that last confirmation of breakout, then we will be looking

SANDUSDTdowntrend move :
SANDUSDT market structure
for now making correction move, taking inducement before impulsive move.
SANDUSDT Forming Bullish ReversalSANDUSDT is showing a promising technical setup that could attract more attention in the coming days. The chart clearly highlights a well-defined downward channel which many traders recognize as a potential bullish reversal zone, similar to a falling wedge pattern. The good trading volume adds more

SAND/USDT at Critical Support Zone – Rebound Potential?Detailed Technical Analysis:
The SAND/USDT weekly chart shows the price currently hovering around a historically strong support zone between $0.20 – $0.25. This yellow-marked demand area has been tested multiple times since 2021 and has consistently prevented further downside, making it a crucial d

Análisis Técnico Multidireccional SAND USDT. Overall Trend and Price Patterns:
In the long and medium term, SAND's trend is bearish. This is confirmed by the 4-hour charts and higher, where lower highs and lower lows are observed. The "Smart Money Concept" indicator also indicates a "Trend: Negative".
A descending channel has been identifi

See all ideas
Summarizing what the indicators are suggesting.
Oscillators
Neutral
SellBuy
Strong sellStrong buy
Strong sellSellNeutralBuyStrong buy
Oscillators
Neutral
SellBuy
Strong sellStrong buy
Strong sellSellNeutralBuyStrong buy
Summary
Neutral
SellBuy
Strong sellStrong buy
Strong sellSellNeutralBuyStrong buy
Summary
Neutral
SellBuy
Strong sellStrong buy
Strong sellSellNeutralBuyStrong buy
Summary
Neutral
SellBuy
Strong sellStrong buy
Strong sellSellNeutralBuyStrong buy
Moving Averages
Neutral
SellBuy
Strong sellStrong buy
Strong sellSellNeutralBuyStrong buy
Moving Averages
Neutral
SellBuy
Strong sellStrong buy
Strong sellSellNeutralBuyStrong buy
Displays a symbol's price movements over previous years to identify recurring trends.
Frequently Asked Questions
The current price of SAND / TetherUS (SAND) is 0.3098 USDT — it has risen 0.94% in the past 24 hours. Try placing this info into the context by checking out what coins are also gaining and losing at the moment and seeing SAND price chart.
SAND / TetherUS price has fallen by −7.19% over the last week, its month performance shows a 17.51% increase, and as for the last year, SAND / TetherUS has increased by 0.98%. See more dynamics on SAND price chart.
Keep track of coins' changes with our Crypto Coins Heatmap.
Keep track of coins' changes with our Crypto Coins Heatmap.
SAND / TetherUS (SAND) reached its highest price on Nov 25, 2021 — it amounted to 8.4876 USDT. Find more insights on the SAND price chart.
See the list of crypto gainers and choose what best fits your strategy.
See the list of crypto gainers and choose what best fits your strategy.
SAND / TetherUS (SAND) reached the lowest price of 0.0083 USDT on Aug 14, 2020. View more SAND / TetherUS dynamics on the price chart.
See the list of crypto losers to find unexpected opportunities.
See the list of crypto losers to find unexpected opportunities.
The safest choice when buying SAND is to go to a well-known crypto exchange. Some of the popular names are Binance, Coinbase, Kraken. But you'll have to find a reliable broker and create an account first. You can trade SAND right from TradingView charts — just choose a broker and connect to your account.
Crypto markets are famous for their volatility, so one should study all the available stats before adding crypto assets to their portfolio. Very often it's technical analysis that comes in handy. We prepared technical ratings for SAND / TetherUS (SAND): today its technical analysis shows the buy signal, and according to the 1 week rating SAND shows the neutral signal. And you'd better dig deeper and study 1 month rating too — it's sell. Find inspiration in SAND / TetherUS trading ideas and keep track of what's moving crypto markets with our crypto news feed.
SAND / TetherUS (SAND) is just as reliable as any other crypto asset — this corner of the world market is highly volatile. Today, for instance, SAND / TetherUS is estimated as 3.07% volatile. The only thing it means is that you must prepare and examine all available information before making a decision. And if you're not sure about SAND / TetherUS, you can find more inspiration in our curated watchlists.
You can discuss SAND / TetherUS (SAND) with other users in our public chats, Minds or in the comments to Ideas.