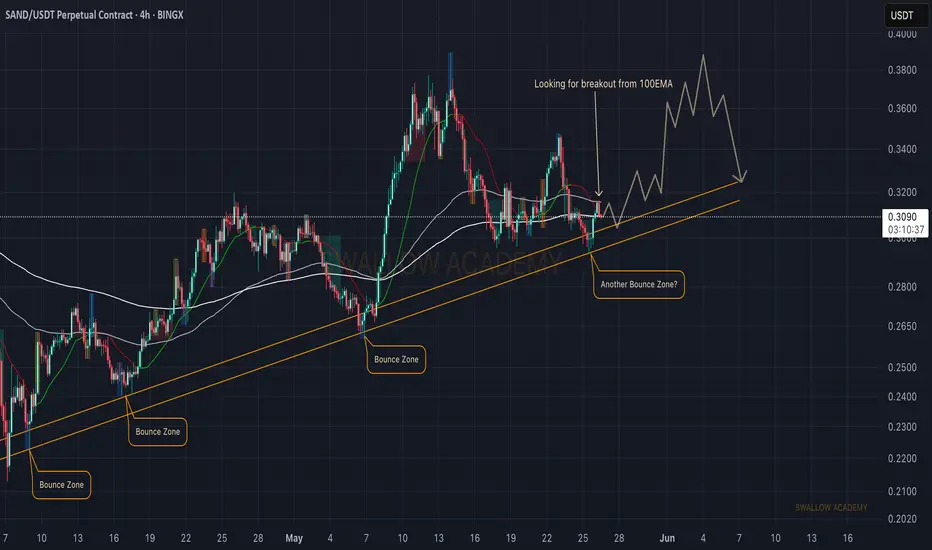
Sandbox (SAND): Patience Is Key | Waiting For Long EntrySandbox is at its local support area, where we are seeing the pressure from sellers, which might turn into a proper foundation for upcoming buyside movement.
We are looking for the area near the 100EMA to be secured by buyers, after which we will be looking for long!
Swallow Academy
Related pairs

SAND analysis: Price is currently testing the support area; a break below this level would indicate a bearish trend. A candle closing below this point will likely lead to more downward movement. You may consider opening a long position, but with a tight stop-loss.

Análisis Técnico Multidireccional SAND USDT. Overall Trend and Price Patterns:
In the long and medium term, SAND's trend is bearish. This is confirmed by the 4-hour charts and higher, where lower highs and lower lows are observed. The "Smart Money Concept" indicator also indicates a "Trend: Negative".
A descending channel has been identifi

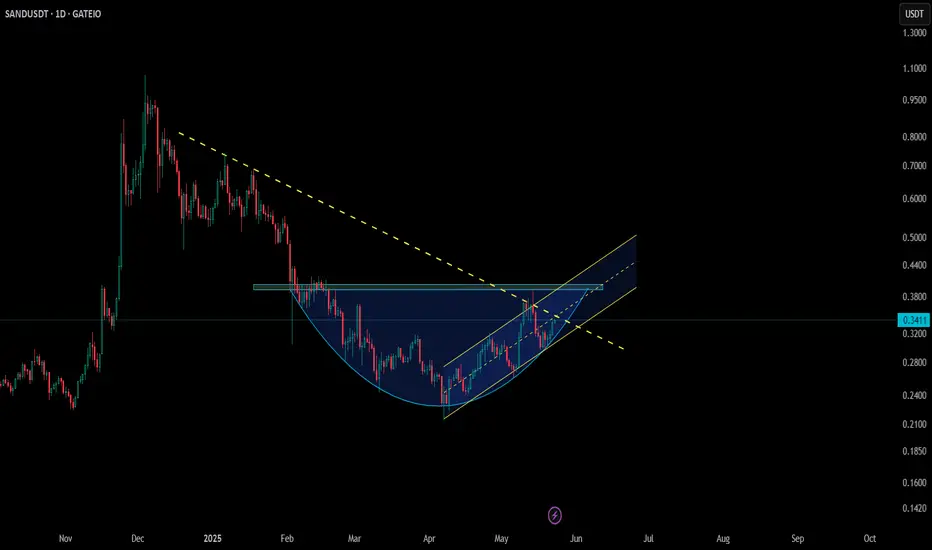
SANDUSDT 1D#SAND is currently trading inside a Falling Wedge on the daily chart.
Let’s see if it can hold the wedge support and bounce from here.
Looking at the bigger picture, it may be forming a Double Bottom.
Just like it broke out of the descending channel in April, we could now see a breakout above the w

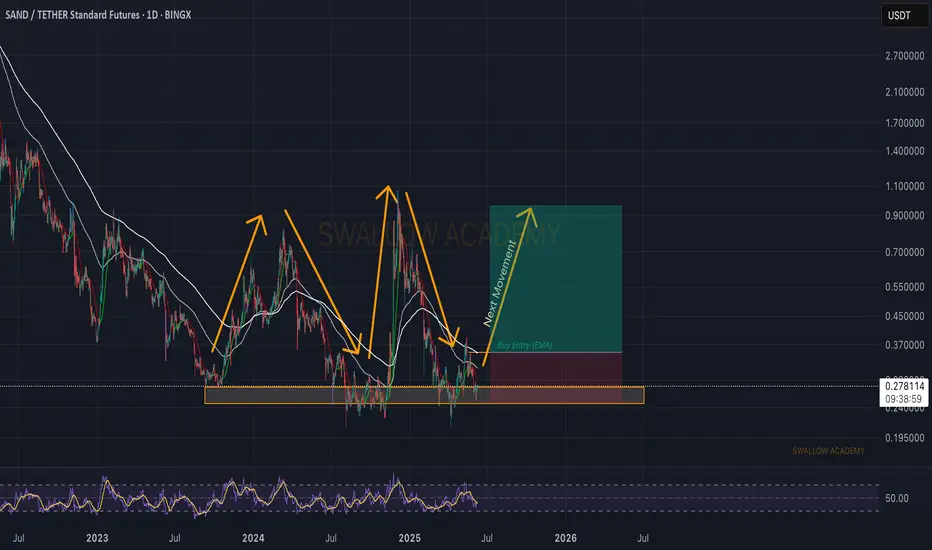
The Sandbox (SAND): Reached Strong Bullish Trend | Bounce AreaSandbox coin has recently touched again the local bullish trend from which we have been seeing some great upward movement (previously). With current bullish sentiment in the markets, we might be seeing a strong upward movement from here, and the 100EMA is our last confirmation for now.
Upon seeing
Sandbox (SAND): Seeing Break of Structure Forming | Buy Area?Sandbox is another coin that has formed a break of structure, which can send the price higher. As long as we keep the current momentum of volume from side, we are aiming to see that upper area reached within days!
Swallow Academy

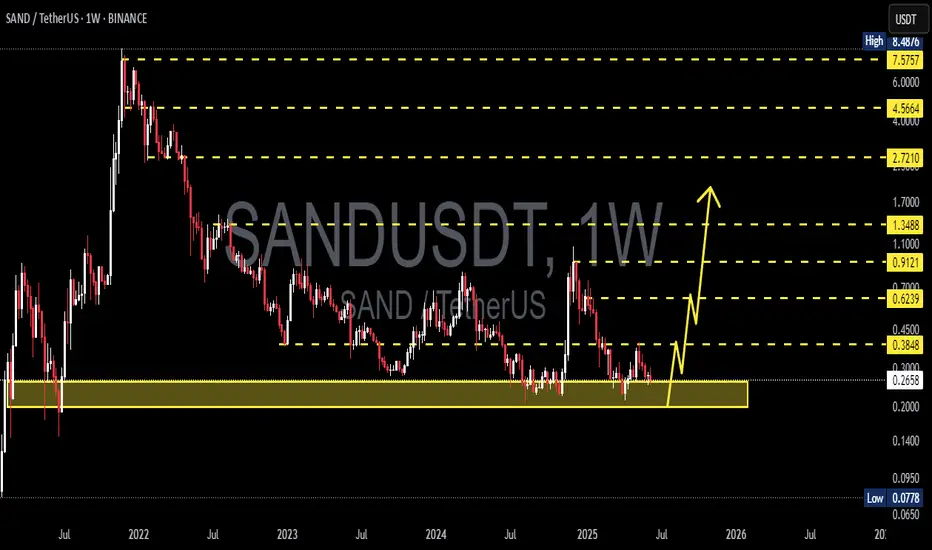
SANDUSDT 1W AnalysisSAND ~ 1W Analysis
#SAND Buy back gradually from here if you still have confidence in this coin with a short term target of at least 20%+ from this support.
sand buy spot "🌟 Welcome to Golden Candle! 🌟
We're a team of 📈 passionate traders 📉 who love sharing our 🔍 technical analysis insights 🔎 with the TradingView community. 🌎
Our goal is to provide 💡 valuable perspectives 💡 on market trends and patterns, but 🚫 please note that our analyses are not intended as buy o

The Sandbox (SAND): Golden Buy Zone | Now or Never...Sand is one of the good long-term coins that caught our attention, where the price is at a local bottom...waiting for a proper breakout from EMAs, which would give us an easy 2.5x on the price.
There is not much to say but rather just wait patiently and enter at the right moment!. Very good R:R tr
$SAND – Ascending Channel Meets Round Bottom🔥 NYSE:SAND – Structure Building Up
📆 On the daily timeframe, NYSE:SAND is forming a round bottom while also trending inside an ascending channel — signaling strong structural momentum 📈
⚠️ It’s now testing a key trendline resistance around $0.35 — a breakout here could trigger the next move up
See all ideas
Summarizing what the indicators are suggesting.
Oscillators
Neutral
SellBuy
Strong sellStrong buy
Strong sellSellNeutralBuyStrong buy
Oscillators
Neutral
SellBuy
Strong sellStrong buy
Strong sellSellNeutralBuyStrong buy
Summary
Neutral
SellBuy
Strong sellStrong buy
Strong sellSellNeutralBuyStrong buy
Summary
Neutral
SellBuy
Strong sellStrong buy
Strong sellSellNeutralBuyStrong buy
Summary
Neutral
SellBuy
Strong sellStrong buy
Strong sellSellNeutralBuyStrong buy
Moving Averages
Neutral
SellBuy
Strong sellStrong buy
Strong sellSellNeutralBuyStrong buy
Moving Averages
Neutral
SellBuy
Strong sellStrong buy
Strong sellSellNeutralBuyStrong buy
Displays a symbol's price movements over previous years to identify recurring trends.
Frequently Asked Questions
The current price of The Sandbox / Tether (SAND) is 0.25572 USDT — it has risen 10.14% in the past 24 hours. Try placing this info into the context by checking out what coins are also gaining and losing at the moment and seeing SAND price chart.
The Sandbox / Tether price has fallen by −0.18% over the last week, its month performance shows a −7.38% decrease, and as for the last year, The Sandbox / Tether has decreased by −22.01%. See more dynamics on SAND price chart.
Keep track of coins' changes with our Crypto Coins Heatmap.
Keep track of coins' changes with our Crypto Coins Heatmap.
The Sandbox / Tether (SAND) reached its highest price on Nov 25, 2021 — it amounted to 8.48951 USDT. Find more insights on the SAND price chart.
See the list of crypto gainers and choose what best fits your strategy.
See the list of crypto gainers and choose what best fits your strategy.
The Sandbox / Tether (SAND) reached the lowest price of 0.14756 USDT on Jun 22, 2021. View more The Sandbox / Tether dynamics on the price chart.
See the list of crypto losers to find unexpected opportunities.
See the list of crypto losers to find unexpected opportunities.
The safest choice when buying SAND is to go to a well-known crypto exchange. Some of the popular names are Binance, Coinbase, Kraken. But you'll have to find a reliable broker and create an account first. You can trade SAND right from TradingView charts — just choose a broker and connect to your account.
Crypto markets are famous for their volatility, so one should study all the available stats before adding crypto assets to their portfolio. Very often it's technical analysis that comes in handy. We prepared technical ratings for The Sandbox / Tether (SAND): today its technical analysis shows the neutral signal, and according to the 1 week rating SAND shows the sell signal. And you'd better dig deeper and study 1 month rating too — it's sell. Find inspiration in The Sandbox / Tether trading ideas and keep track of what's moving crypto markets with our crypto news feed.
The Sandbox / Tether (SAND) is just as reliable as any other crypto asset — this corner of the world market is highly volatile. Today, for instance, The Sandbox / Tether is estimated as 13.25% volatile. The only thing it means is that you must prepare and examine all available information before making a decision. And if you're not sure about The Sandbox / Tether, you can find more inspiration in our curated watchlists.
You can discuss The Sandbox / Tether (SAND) with other users in our public chats, Minds or in the comments to Ideas.