sandUSDTsand USDT
salam b hamgi
sand ba shekast in moqavemat mitone ye harkat ro b bala khobi dashte bashe
SANDUSDT trade ideas

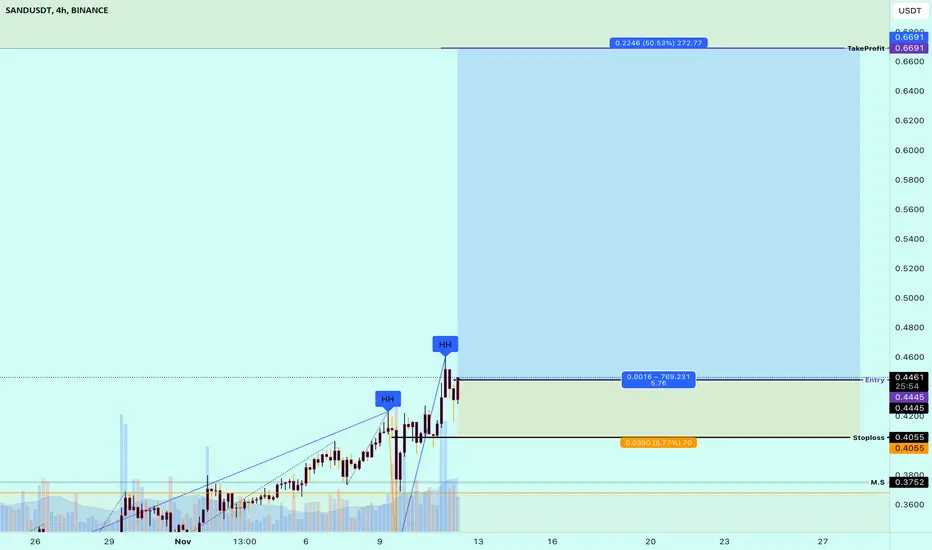
SAND target 0.564h time frame
-
SAND is creating a potential bottom head and shoulders, the right shoulder hasn't been formed yet. Currently, 0.37 achieve the condition of HS, but shall notice another possibility that SAND go back to 0.35 to make the low of right shoulder.
I will provide another trading plan if SAND reach 0.35, and now we can follow this plan which targets as below.
TP: 0.56 / 0.66
SL: 0.381

LONG SANDlong on sand , obvious pennant pattern
targets are given in the yellow lines
not a financial advice
thank you

sandbox buying zone I see this zone (indicated in blue rectangle ) 0.68 - 0.62$ , a good discount for buying sandbox for long time investment . This could be reached when btc bottomed at 14-10k .
Notice : as we are right now , 21-17k BTC range , every one can begin to accumulate their desirable tokens , for example 30% now and the rest when prices reached the area mentioned , because the market is a guessing game , no one know exactly what would happen . its okay to start DCA now , because we are already +80% down from almost all ALTS ATH . I want to point out , that the price could go even lower than the zone mentioned , however , as i mentioned before , from here every one can start DCA , no one could catch the real bottom unless he has a time travel machine .
not a financial advice , only for entertainment .
thank you

SAND/USDT DailyAs mentioned in the previous analysis on the daily chart, the price moved towards support.
if it close and stabilizes below the line, a new analysis will be updated.

SAND/USDTsee how much money you can make when you can identify patterns before they actually form, can you see the cup and handle pattern?

The Sandbox (SANDUSDT)Over the last two weeks, SAND has been consolidating between the daily 200MA support at $0.40 and the $0.45 - $0.465 resistance level. A potential breakout could target $0.5770 - $0.6170. 🚀📈
#SAND #Cryptocurrency 🌐💰

#SAND Short Term Plan#SAND Short Term Plan.. #SAND is ready to clear upside liquidity / previous days high.


SAND/USDT It required Break to continue Upward movement !!💎 SAND has indeed caught the market's attention with its remarkable ascent. It is currently facing a challenge in breaking through the supply area at $0.4, and there are clear signs of bearish rejection in this area.
💎 If it fails to break through this resistance in the near future, there's a possibility that SAND could decline and retest the demand area around $0.339 to gather new momentum. However, if SAND successfully breaks the supply area, it opens the door for further upward movement and the probability to reach our target in the supply area.
💎 In the bad scenario, if SAND retraces to the demand area at $0.339 and doesn't show signs of a bounce, it suggests a potential breakdown of the demand level. If this occurs, it indicates a bearish momentum, and there's a possibility that SAND may continue its descent, possibly returning to the strong support area.

SAND/USDTThis is not a selling signal!!
Now we have to wait and see if it forms a H & SH upward or breaks the resistance from here and moves towards 0.7$ and 1$

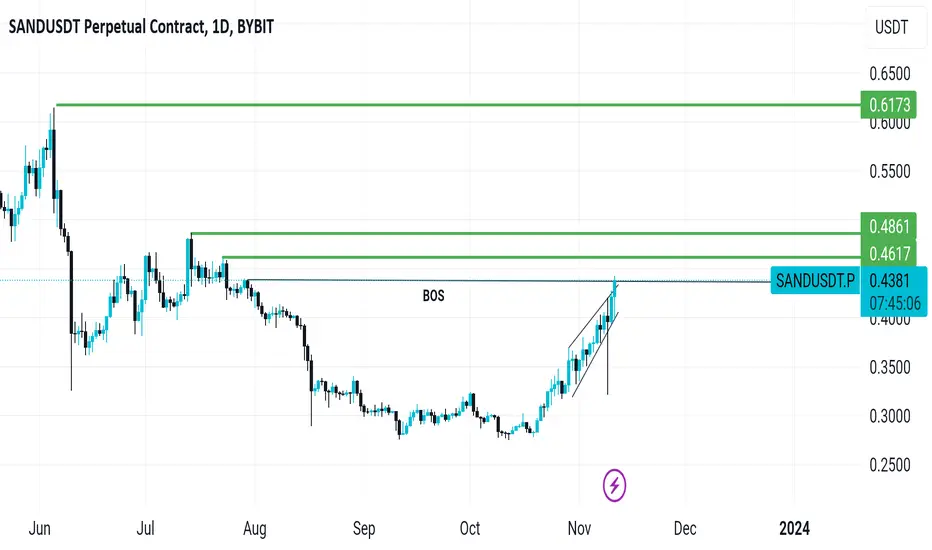
🏝️🗺️ Sandbox Surge: Building Castles in the Crypto Sky 🚀 🏖️Sandbox has been playing in the sand for a while, staying quiet, but it's looking ready to sculpt a bullish masterpiece. 🎨 After a long, flat stretch where it seemed to be collecting seashells, we finally saw that breakout we've been beachcombing for. 🌊
The chart's telling tales of tides turning, with a breakout above 0.3783 hinting at bullish currents strong enough to carve new landscapes in the market. 🗺️ As for the next checkpoint in our sandbox adventure? I'm eyeing a sunny spot at 0.5932, where the sea meets the shore. ☀️
Just like building a sandcastle, this trade needs a blueprint. Keep your shovels ready and watch the tide—because if it swells, we could be riding the wave all the way to new heights. 🌅 And who knows? Maybe it's time for Sandbox to show the crypto world that playtime can be profitable. 🏖️
Remember, even in the sandbox, keep a playful eye on the bigger beach—that's where the real sandcastles are built. 🏰 Let's build our portfolios with the same joy a child brings to their sandy forts!
🏖️🚀🌊🎨🗺️☀️🏰News:
Let's delve into some recent headlines that are shaping its landscape:
🌐 This Metaverse Altcoin Announced Its New Fund - Sandbox is fueling innovation with fresh funding. Time to watch these digital grains of sand turn into gold? link: en.bitcoinsistemi.com
🛠️ The Metaverse's Future Shaped by Creators - Creativity is currency in the metaverse, and Sandbox is minting a new era where imagination is wealth. Link: www.cryptopolitan.com
🏍️ Valentino Rossi Races into the Metaverse: The Sandbox's Latest Power Move - The legend of the tracks brings his legacy into the sands of the metaverse, promising an exhilarating blend of speed and pixels. Link: en.cryptonomist.ch
💳 Mastercard Meets Metaverse: Spend NYSE:SAND with a Swipe! 💥
Big news in the dunes, folks! Mastercard's now letting you spend your NYSE:SAND tokens like you're shopping in the real world. 🌍💳 No more hoarding your digital treasure; it's time to swipe and let your NYSE:SAND flow. Link: www.coindesk.com
In the Sandbox, every grain could be a part of the next digital masterpiece. Let's keep our creative spirits high and our portfolios ready for the next wave of innovation. 🖌️🌅
Playful strategies and vigilant eyes - that's how we'll sculpt our success in the Sandbox. To prosperity and beyond! 🚀
🚀🎨🏰☀️🌊🌐🛠️🏍️🖌️🌅
One Love,
The FXPROFESSOR 💙
SAND/USDT Had a Good Run 🚀| What's Next for SAND?💎Yello, Paradisers! turn your focus to SAND/USDT. We've spotted some compelling price dynamics. A standout observation is the rejection from the bearish OB, shedding light on the asset's potential direction.
💎From our latest analysis, SAND has successfully broken away from a descending trendline, setting its sights upward. We're currently anticipating two possible scenarios:
💎The Sandbox might undergo a slight retracement, finding support and bullish drive from the demand level at 0.3386, with an aim to challenge the bearish OB once more.
💎If SAND faces challenges in holding its ground above the .3936 demand mark, it's likely to seek bullish support from the .3386 demand zone. Yet, if it drops below this level, bearish movements could be on the horizon.
💎Always stay alert and craft your strategies based on these potential outcomes. Refine your trading decisions for SAND with ParadiseFamilyVIP.

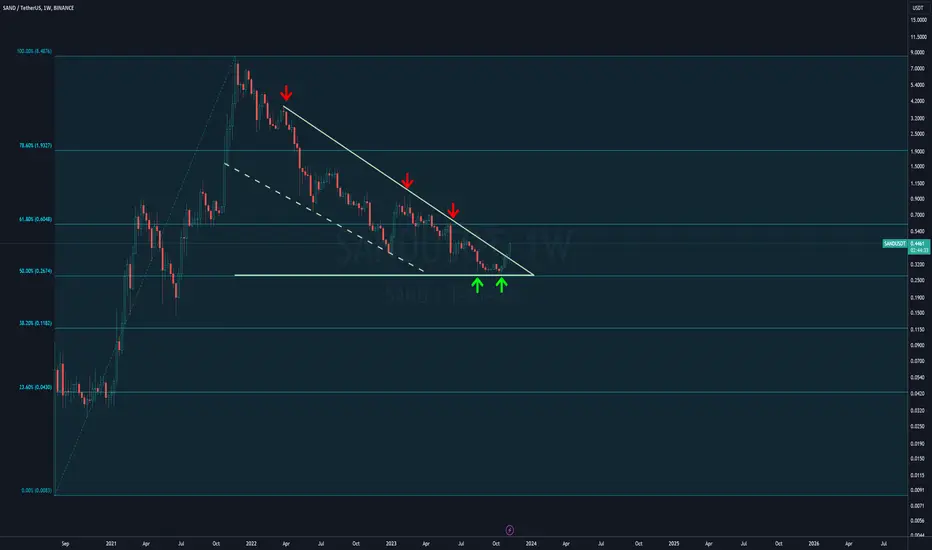
SANDBOX (SAND) Bullish Long Term - Descending Tri Breakout SAND Long term looks major bullish, descending tri breakout confirmed with 3 points of contacts. The lowest bottom support looks to be back in: Oct, 2023. Since the 2 years has of a bear market, the price recently is riding a wave to the upside.
Weekly time frame.. if in doubt, zoom out! 👁️
Sand Price Surge Alert! 📈 - Your Path to Wealth Starts Here"**Sand Coin (SAND)** is a utility token used in The Sandbox, a virtual world where users can create, own, and monetize their gaming experiences. SAND is used to purchase assets in The Sandbox, such as land, avatars, and other items. It can also be used to participate in governance and earn rewards.
**Recent news:**
* On November 10, 2023, The Sandbox announced a partnership with Warner Bros. Interactive Entertainment to launch a dedicated Warner Bros. world in The Sandbox. This world will feature characters and experiences from popular Warner Bros. franchises, such as DC Comics, Looney Tunes, and Harry Potter.
* On November 8, 2023, The Sandbox announced the launch of its Alpha Season 3. This season features a number of new updates and improvements, including a new game mode, new assets, and a new user interface.
**Fundamental analysis:**
* The Sandbox is a popular virtual world with over 2 million active users.
* The Sandbox has a strong team and a well-funded development roadmap.
* SAND has a number of utility cases within The Sandbox, such as purchasing assets, participating in governance, and earning rewards.
* SAND has a limited supply, which could lead to price appreciation in the long term.
**Disclaimer:**
This is not financial advice. Do your own research before investing in any cryptocurrency.
Bullish Scenario on $SEND#Send is making it's way out of the structure and I consider it bullish
The green lines are my targets
SANDBOX(SAND) - Double Bottom & TP
* 1D
SAND has a double bottom pattern.
It seems to be bullish.
Based on the above, TP can be set at 5 places.

SAND usdt chart updateSAND usdt chart update buy now 9-11-2023
SAND chart technical analysis - SAND coin price analysis SANDUSDT BUY NOW #SANDUSDT #SAND
@SAND

SAND late moverTime to Dollar cost averaging for SAND.
Long daily trendline resist has been broken out, time to retest the S&R and get an open long position. Might need more than 1 month to set up.
NFA

Grab the SANDWe have a large diametric for SAND. To complete the F branch, we can go up. If it pull back to the green zone, it is a good opportunity to buy/long.
For risk management, please don't forget stop loss and capital management
Comment if you have any questions
Thank You

SANDUSDT Sell SignalThe bearish setup in the sand has already been confirmed. This position goes against the main trend, so caution is advised. Risk reward 1:5

SAND channelFollowing this SAND channel, think price will come back to the bottom of the channel before heading back up. Will need to re-assess as we get to the bottom of the channel.
If BTC is coming down, then may lose the bottom which will confirm macro downtrend.

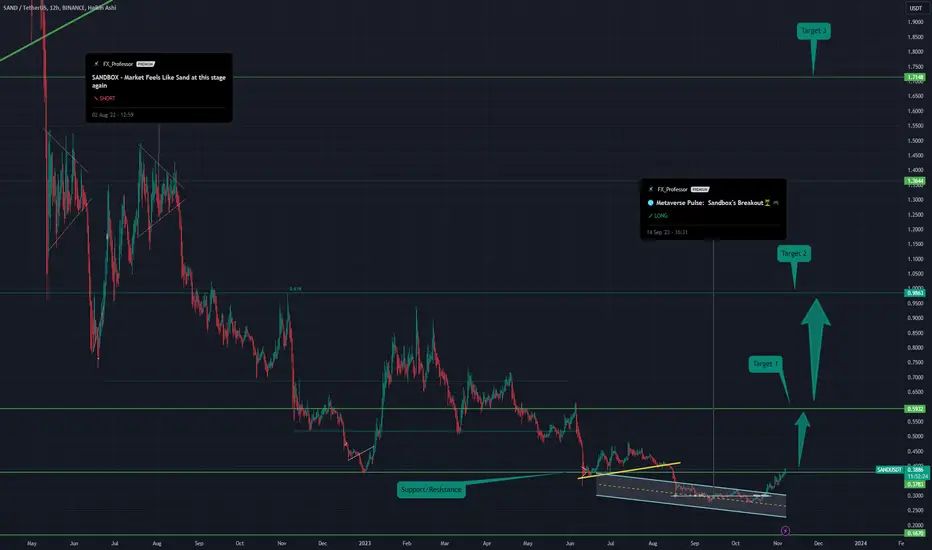
🌐 Metaverse Pulse: Sandbox's Breakout🏝️🎮🌐 Metaverse Pulse: 📈 AXIE Infinity's Rise, 🚀 Decentraland's Gains, and 🎮 Sandbox's Breakout—What Investors Need to Know 🤑"
"Hey folks, let's dive into the metaverse 🌌, with a special focus on Sandbox 🏝️. Today, AXE Infinity's AXS is up a solid 17% 📈, and Decentraland's Mana is gaining at 7.2% 🚀.
Sandbox is lagging a bit, but it's showing a promising breakout above 30 cents 💎, breaking past previous resistance. Binance delisted it, causing an all-time low 😬.
But there's also an explosive land update 🌋, which is huge news. So, should investors hold or fold? My bet's on hold 🤔.
Despite some hiccups (and heart attacks), like 99% of play-to-earn investors counting losses 😓, the metaverse is still a hot sector 🔥. Remember, Sandbox had a massive 300 million token unlock four weeks ago 🗝️.
So, keep an eye on Sandbox whales 🐳; they could turn the tide.
Bottom line: Sandbox is a standout project in the metaverse 🌟. I'm bullish on it 🐂. This is Professor, signing off and going Long on SANDBOX. My favorite Metaverse token. Peace ✌️."
One Love,
The FXPROFESSOR 💙
