SAND Buy Limit 😎✅😎✅😎✅Hi dear traders
SAND has formed bullish pattern.
Possible Movement in 4H time frame.
We can open long position and take some profit 📈 in short term.
Let's see what happens
All targets specified
This is not financial advice ( DYOR )
Good luck
SANDUSDT trade ideas

sandusdtNobody Knows Where is Price Going.
Hey traders, here is the analysi.
If you guys like my analysis please hit like?? and follow.
Thanks.
DISCLAIMER- This is not financial advice.
SMART MONEY CONCEPT.
identify Liquidity Or Become Liquidity

SAND S&R LVL >>>>>>>>>>>Hello EveryOne
I Have Tried My Best to Bring the best Possible outcome in this Chart.
Everything is cleared on the chart.
Chart pattern/support&resistance's/Important lvl.
It's published just to know the support and resistance of the currency price.not a signal.
It's just an analyze,
Not a financial advise.
PLZ DYOR
With hopping success>>>>>

long for sand is goodWe are waiting to receive for long or short, but the reviews give more possibility of growth, so let's be optimistic.

SAND 2h TF CnH formation Hello Traders, BINANCE:SANDUSDT.P
As we see sand in completed formation of a Cup and Handle, and it has been trying to break that neck line been a couple of time, a break out from the nest neck could send the price to wards the 1st white dotted line and then eventually towards the second white dotted line above
At the time to charting this, SAND/USDT.P was trading 0.5360
Always DYOR ✔️
Trade well my friends
Stay SAFU, and Let that Sink in 😉

sandboxSand technical analysis basically on elliott waves Principles and priceaction strategy
Sand can be grow to 1.40$
wait and watch

SANDUSDTSANDUSDT breakthrough resistance and now is in good bullish momentum.
A retest of broken resistance along with 38% Fib level will be a good area of value for another bullish leg.

Sand Preparing For Massive recovery Seems Like getting ready For Massive Breakout Formed Descending Channel In 3days Timeframe Incase Of Breakout expecting 250 to 280% Bullish Wave


SANDUSD ❕ broken the downtrend lineRSI indicates that a bullish divergence is forming on the 4H Timeframe.
The RSI chart is near neutral values (4H, 1H and 30m TFs)
50EMA has broken up 200EMA on the 1H Timeframe.
I believe the asset will continue to rise after fixing above the resistance level.

sandIn the short term, it has this resistance that can be corrected to the green box. If the channel breaks, it will be checked again.

SAND Looking bullish (Long entry setup)Sand looks to be reversing back from a pretty important area and after a nice change of character I expect a minot pullback to grab some liquidity before going all the way up!
NFA

🔥SANDBOX CAN CHANGE IT'S TREND SOON: BE READY FOR IT!🔥Hi, friends! SANDBOX is only falling since the beginning of 2023. I think the seller's pressure will end after the squeeze to the trendline and its breakout.
We must enter our long trades before SAND skyrockets.
📊 TRADING PLAN FOR SAND:
🔥 volume growth during the false breakout
🔥 squeeze to the trendline
🔥 bullish BTC is a must-have for altcoins growth
✅ THE MAIN TARGETS FOR SAND:
1. $0.57-0.65 - the value area and strong resistance
2. $0.76-0.80 - the value area
💻Friends, press the "boost"🚀 button, write comments and share with your friends - it will be the best THANK YOU.
P.S. Personally, I open an entry if the price shows it according to my strategy.
Always do your analysis before making a trade.


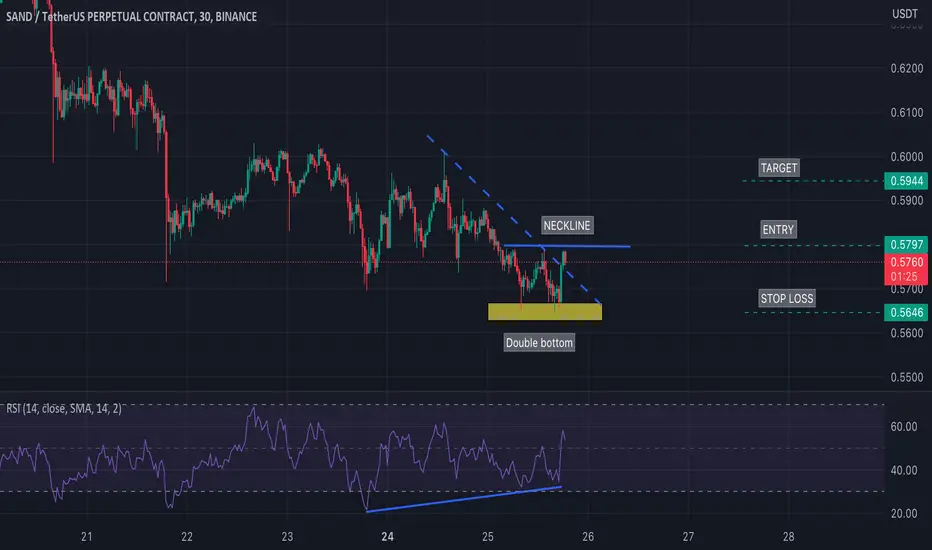
W10-36 SAND BULLISH IDEAPotential Bullish Entry Dow Theory In Place -
Higher High and Higher Low Expected in Place
Formation of double bottom coupled with bullish divergence (Bullish reversal pattern)
Entry, SL & TP Levels are defined.

sand finding support #sand finding support
Market Cap: 1B
Category: NFT / Metaverse
Target 1: 0.78720
Target 2: 0.86738
Target 3: 0.99900
Stop Loss: 0.48009
Manage Risk - have a stop loss in place
Not Financial Advice
This is for Entertainment Only

W9.1-29 SAND SHORT TERM BULLISH IDEAPotential Bullish Entry Dow Theory In Place - Higher High and Higher Low Expected in Place Formation of DOUBLE bottom coupled with bullish divergence (Bullish reversal pattern) SL & TP Levels are defined.
#SANDUSDT (Watchlist) 4-2023Consider adding this BINANCE:SANDUSDT to your watchlist.
When we suggest adding a coin to your watchlist, it means it's forming a pattern or approaching a historical bottom, near or above a good support level, displaying increased trading volume, showing a reversal candle, in an accumulation stage, etc. However, we haven't seen any bullish reaction yet, so we recommend adding it to your watchlist until the right time for entry.
Note:
This isn't financial advice, but an analysis of coin movement (not a buy or sell signal). Before following any ideas, do your own research and practice good risk management.
You can't impose your opinion or force it to happen in the cryptocurrency market. So, be prepared for any outcome.
Remember, the cryptocurrency market is highly volatile and involves both gains and losses. Understand the risks before investing.
Good luck to everyone, and we hope that Allah reconciles and repays us all. 🙏

sandusdtIt is possible for a motive to rise in the form of five waves to the top and the target becomes the second shaded area. If it is able to pass the first shaded area and close its top, it will go to the second area
Note: The analysis fails if it closes below an area 0.5 usdt

W9-33 SAND BULLISH IDEA (HARMONICS BULLISH PATTERN)Potential Bullish Entry
Dow Theory In Place - Higher High and Higher Low Expected in Place
Formation of Harmonic Bullish reversal Pattern coupled with bullish divergence at potential reversal zone (PZR)
Entry at the new HH
SL & TP Levels are defined.

SANDUSD ❕ broken the downtrend lineSAND is trading in the liquidity zone.
Price, RSI chart and trading volumes have formed a bullish divergence (1H TF)
I believe the asset will bounce from the support level.

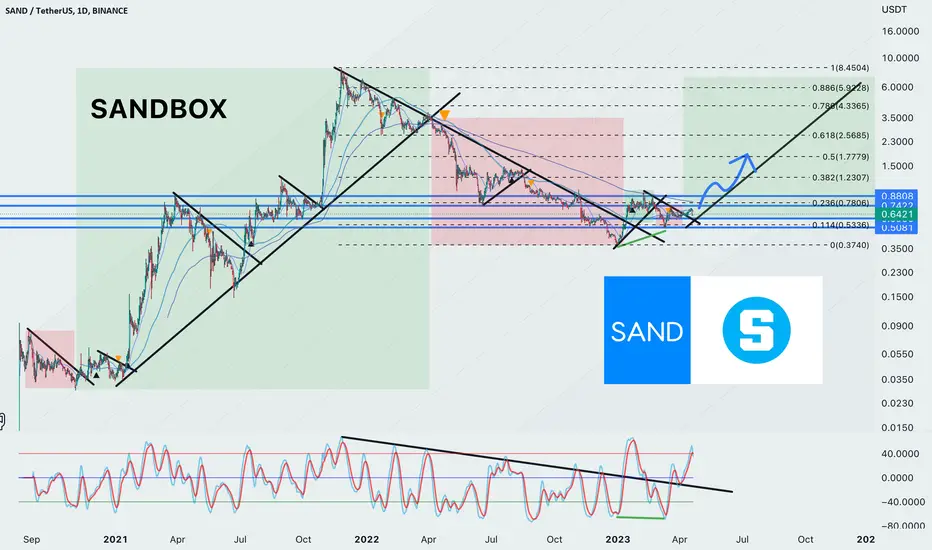
Analyzing the Price Trends of SAND Cryptocurrency SANDBOXThe growth of SAND cryptocurrency in the 2021 year has been nothing short of remarkable. In just 13 months (from 2020), the price of SAND rose from a humble 0.02$ to an impressive 8.00$. This meteoric rise has caught the attention of many investors, who are now scrambling to get in on the action. What is even more impressive is that this growth occurred after a time of great uncertainty in the world, as the COVID-19 pandemic was wreaking havoc on the global economy. Despite these challenges, SAND was able to grow exponentially, proving that its unique blend of gaming and blockchain technology is resonating with a wide range of people. As we look to the future, it's clear that SAND has the potential to continue its growth trajectory.
The SAND cryptocurrency experienced a significant price drop in 2022, with the token falling from its previous high of 8.00$ to just 0.37$. This decline took many investors by surprise, and many were left wondering what the future held for SAND. However, it's important to note that this price drop was not unique to SAND, as the entire cryptocurrency market experienced a bearish trend during this time. Despite this setback, the team behind SAND remained committed to the project, and continued to work on improving the platform and expanding its partnerships. In 2023, the price of SAND finally established a bottom, with the token hovering around the 0.37$ mark. While this is a significant drop from its previous highs, it's important to keep in mind that cryptocurrency markets follow same cycles over and over again.
Based on technical analysis of SAND's chart and its Fractal structure, it's possible that the token may experience a price increase in the coming months. The chart indicates that SAND has been consolidating in a range between 0.3$ and 0.8$ for several months, which could indicate a period of accumulation by investors. Additionally, there has been a recent uptick in trading volume, which may signal increased interest in the token. Based on these factors, it's possible that SAND could see a price increase in the spring or summer of 2023, with the token potentially reaching levels of 2.0$ to 2.56$.